Fig. 3
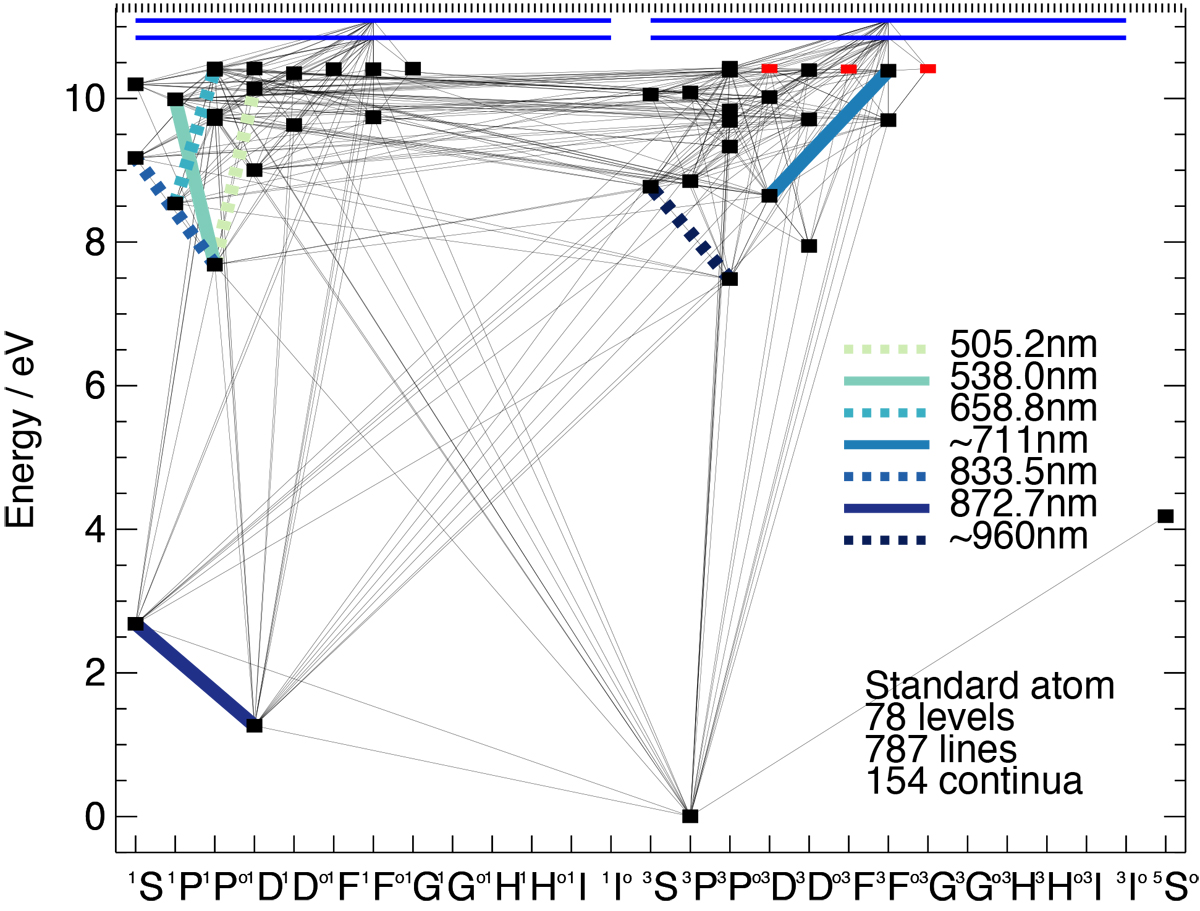
Grotrian diagram for C I in the standard model atom, after reducing the comprehensive model by removing C III and all excited levels of C II, and by constructing super levels. Levels that do not resolve fine structure are shown as red lines, and super levels are shown as long horizontal lines. Some of the C I lines explicitly considered in this work have been highlighted; “~ 711 nm” refers to the C I 711.1 and 711.3 nm lines, and “~ 960 nm” refers to the C I 960.3 and 965.8 nm lines.
Current usage metrics show cumulative count of Article Views (full-text article views including HTML views, PDF and ePub downloads, according to the available data) and Abstracts Views on Vision4Press platform.
Data correspond to usage on the plateform after 2015. The current usage metrics is available 48-96 hours after online publication and is updated daily on week days.
Initial download of the metrics may take a while.