Fig. A.2.
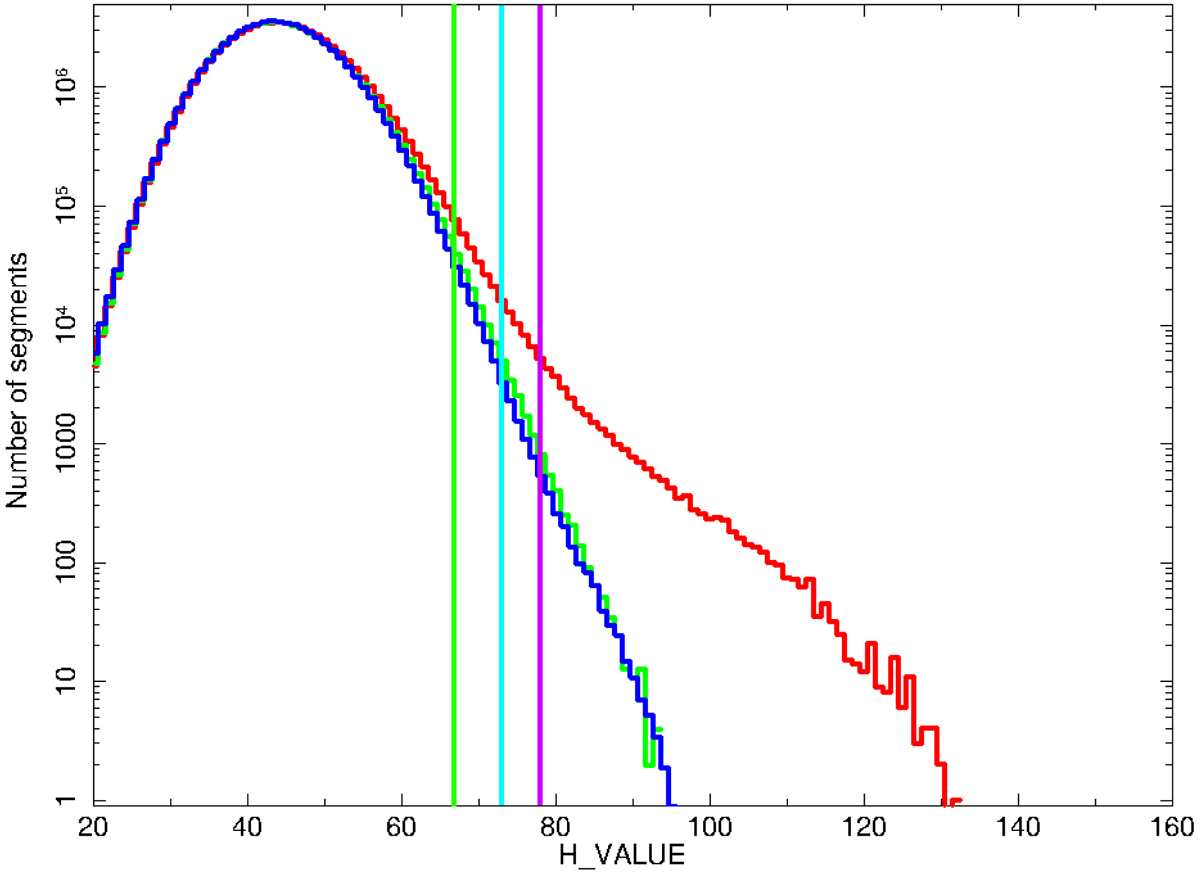
Distribution of H-values for Dw = 40 pixels (∼1′). The red histogram represents the distribution of the real image. The green histogram represents the distribution of the real background, clearly overlapping with the blue histogram, obtained from the simulated background, as expected. We highlight three different H-values with vertical lines, from left to right: 3σ (green), 3.5σ (cyan), and 4σ (violet), representing the chance probability of a spurious detection, as obtained from the simulations. The tail in the real image is apparent.
Current usage metrics show cumulative count of Article Views (full-text article views including HTML views, PDF and ePub downloads, according to the available data) and Abstracts Views on Vision4Press platform.
Data correspond to usage on the plateform after 2015. The current usage metrics is available 48-96 hours after online publication and is updated daily on week days.
Initial download of the metrics may take a while.