Fig. 6.
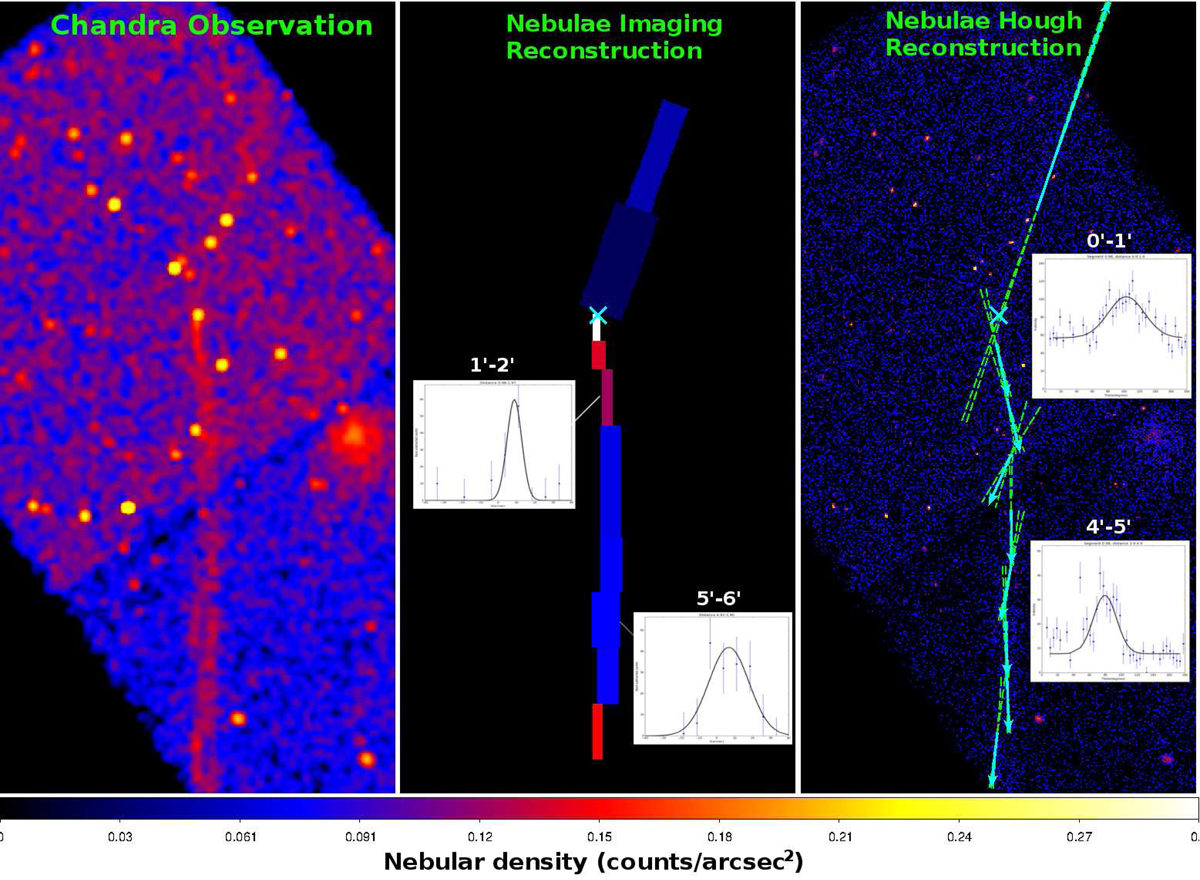
Left panel: 0.3–5 keV Chandra image of the J2055 field. The image has been smoothed with a Gaussian filter. Central panel: graphical representation of the results of the imaging analysis presented in Sect. 3.4. Each box has a count distribution that varies significantly (3σ) from the adjacent distributions. The box thickness contains 95% of the background counts, as from Gaussian describing the distribution. The box intensity is the best-fitted (background-subtracted) counts density within the box. The pulsar position is indicated by a cyan X. We also report a sample of the distributions described in Table 1, where the distance orthogonal to the main axis of the nebula is on the x-axis and on the background-subtracted nebular counts is on the y-axis. Right panel: graphical representation of the results of the MRHT analysis presented in Sect. 3. Each cyan vector is the best-fitted maximum of a distribution significantly (3σ) different from the adjacent distributions. Dotted green lines show the 1σ error on the associated vector. The pulsar position is denoted by a cyan X. As for the central panel, we report a sample of the distributions described in Table 1, where the angle of significant segments from MRHT is on the y-axis.
Current usage metrics show cumulative count of Article Views (full-text article views including HTML views, PDF and ePub downloads, according to the available data) and Abstracts Views on Vision4Press platform.
Data correspond to usage on the plateform after 2015. The current usage metrics is available 48-96 hours after online publication and is updated daily on week days.
Initial download of the metrics may take a while.