Free Access
Fig. 4.
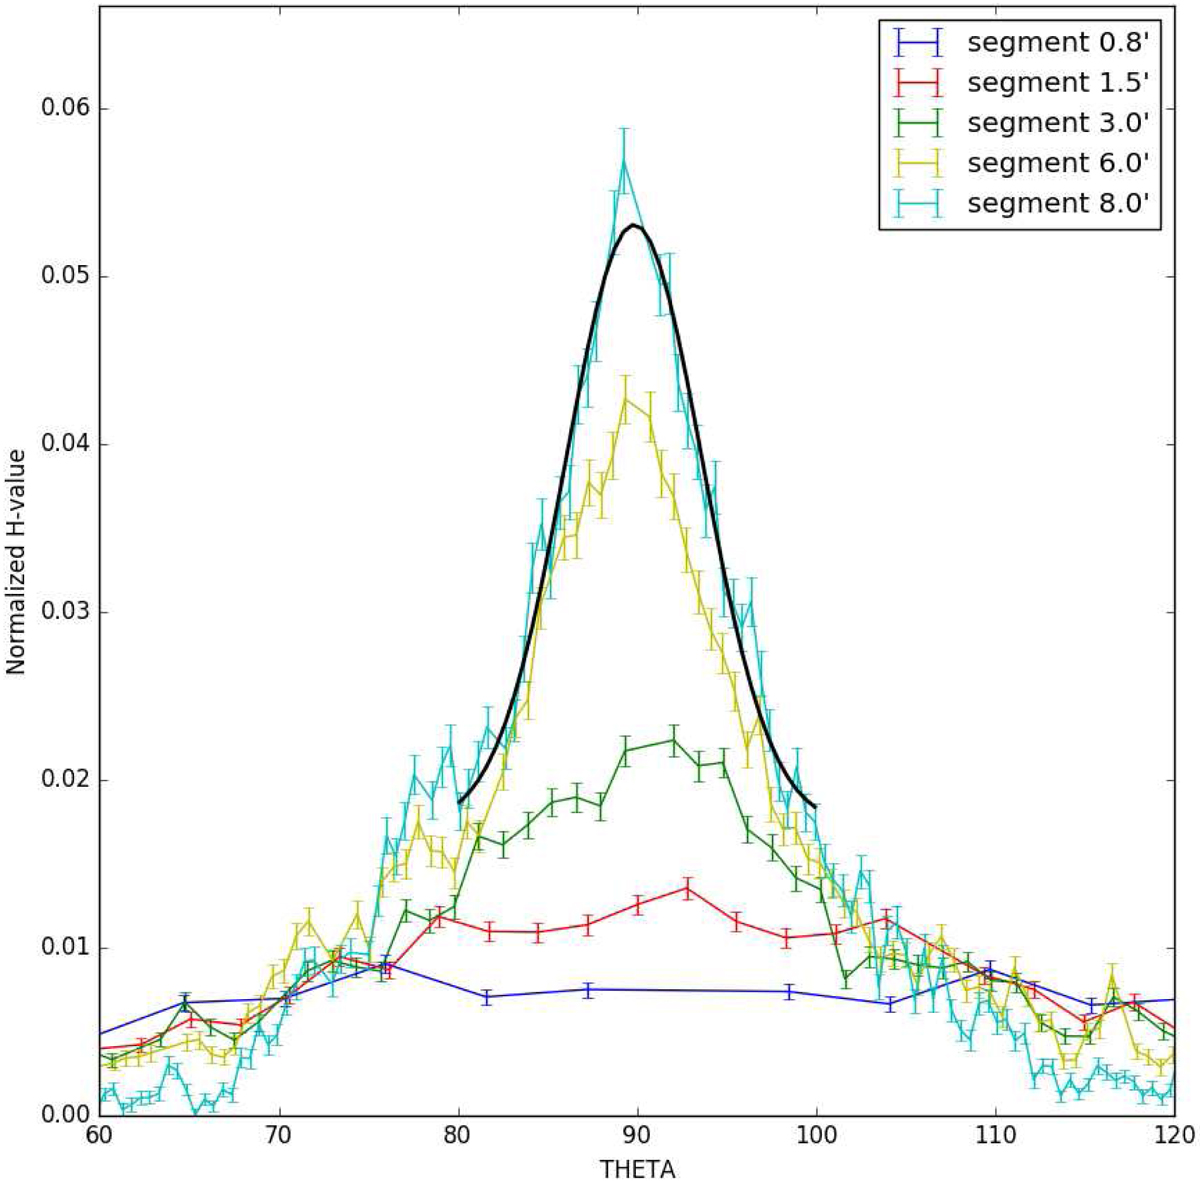
Histogram of the angles obtained through the MRHT for a subsample of segment lengths for the main nebula analysis. Each segment is weighted using its H-value. The histogram integrals are normalized to one. We report the best fit of a constant plus Gaussian for the best segment using 80° < θ < 100°.
Current usage metrics show cumulative count of Article Views (full-text article views including HTML views, PDF and ePub downloads, according to the available data) and Abstracts Views on Vision4Press platform.
Data correspond to usage on the plateform after 2015. The current usage metrics is available 48-96 hours after online publication and is updated daily on week days.
Initial download of the metrics may take a while.