Fig. 3.
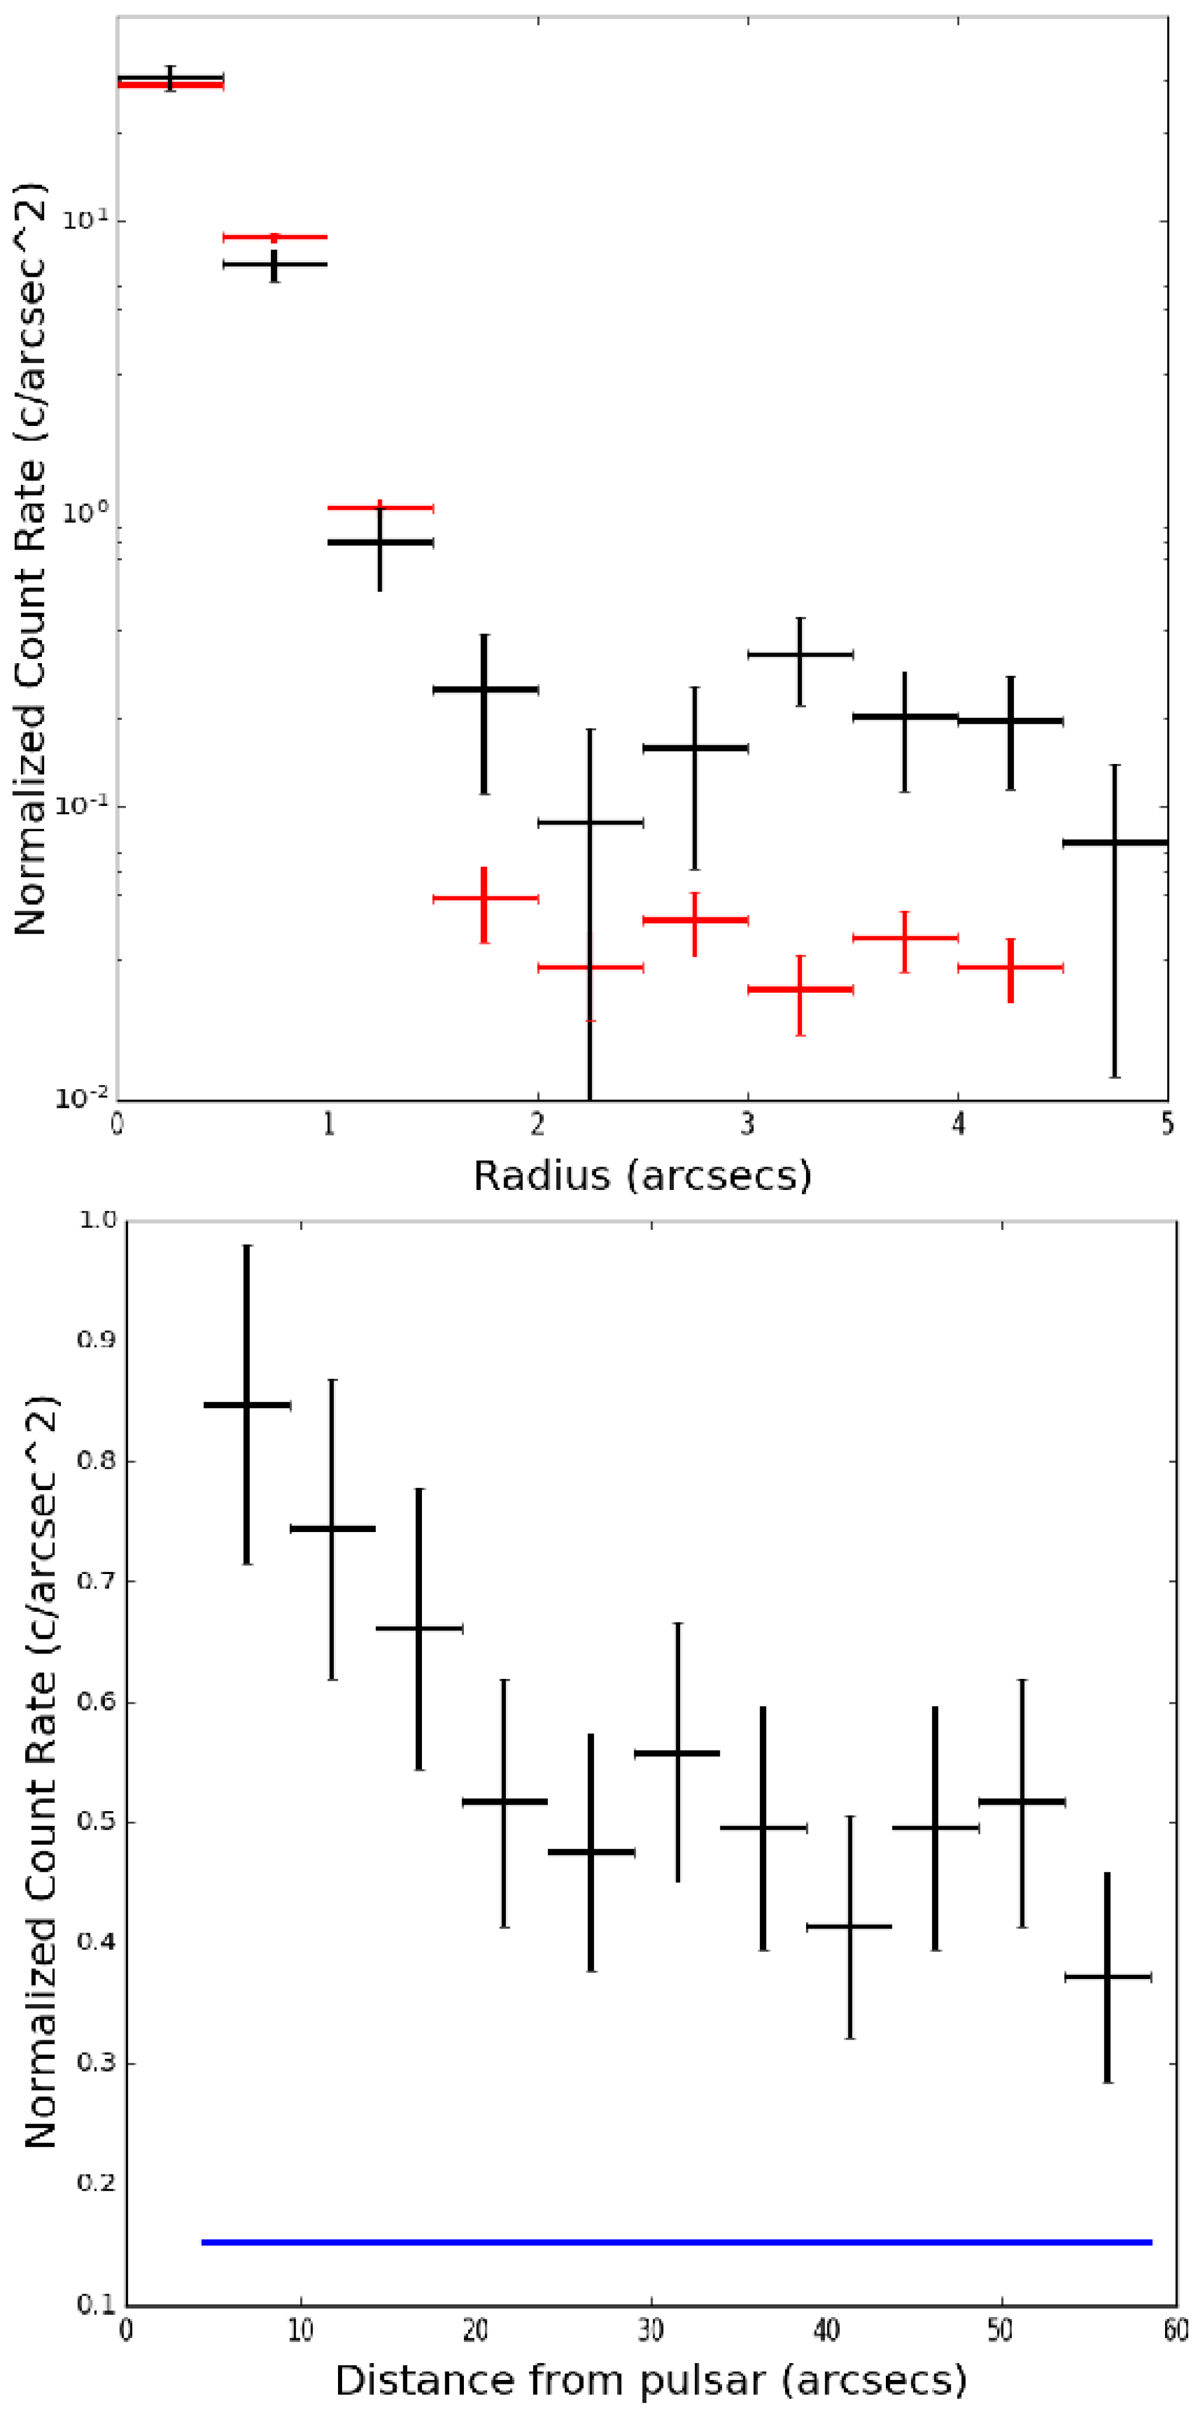
Top panel: circular brightness distribution of the simulated source (red) and the background-subtracted pulsar (black). Within 2″, where the contribution of the main nebula is negligible, the two distributions are in agreement. Bottom panel: linear brightness distribution of the main nebula along its main axis (black) within 1′ of the pulsar. We also show the predicted background (blue line). We excluded a circular region of 2″ radius around the pulsar, where point-like emission dominates.
Current usage metrics show cumulative count of Article Views (full-text article views including HTML views, PDF and ePub downloads, according to the available data) and Abstracts Views on Vision4Press platform.
Data correspond to usage on the plateform after 2015. The current usage metrics is available 48-96 hours after online publication and is updated daily on week days.
Initial download of the metrics may take a while.