Fig. 12.
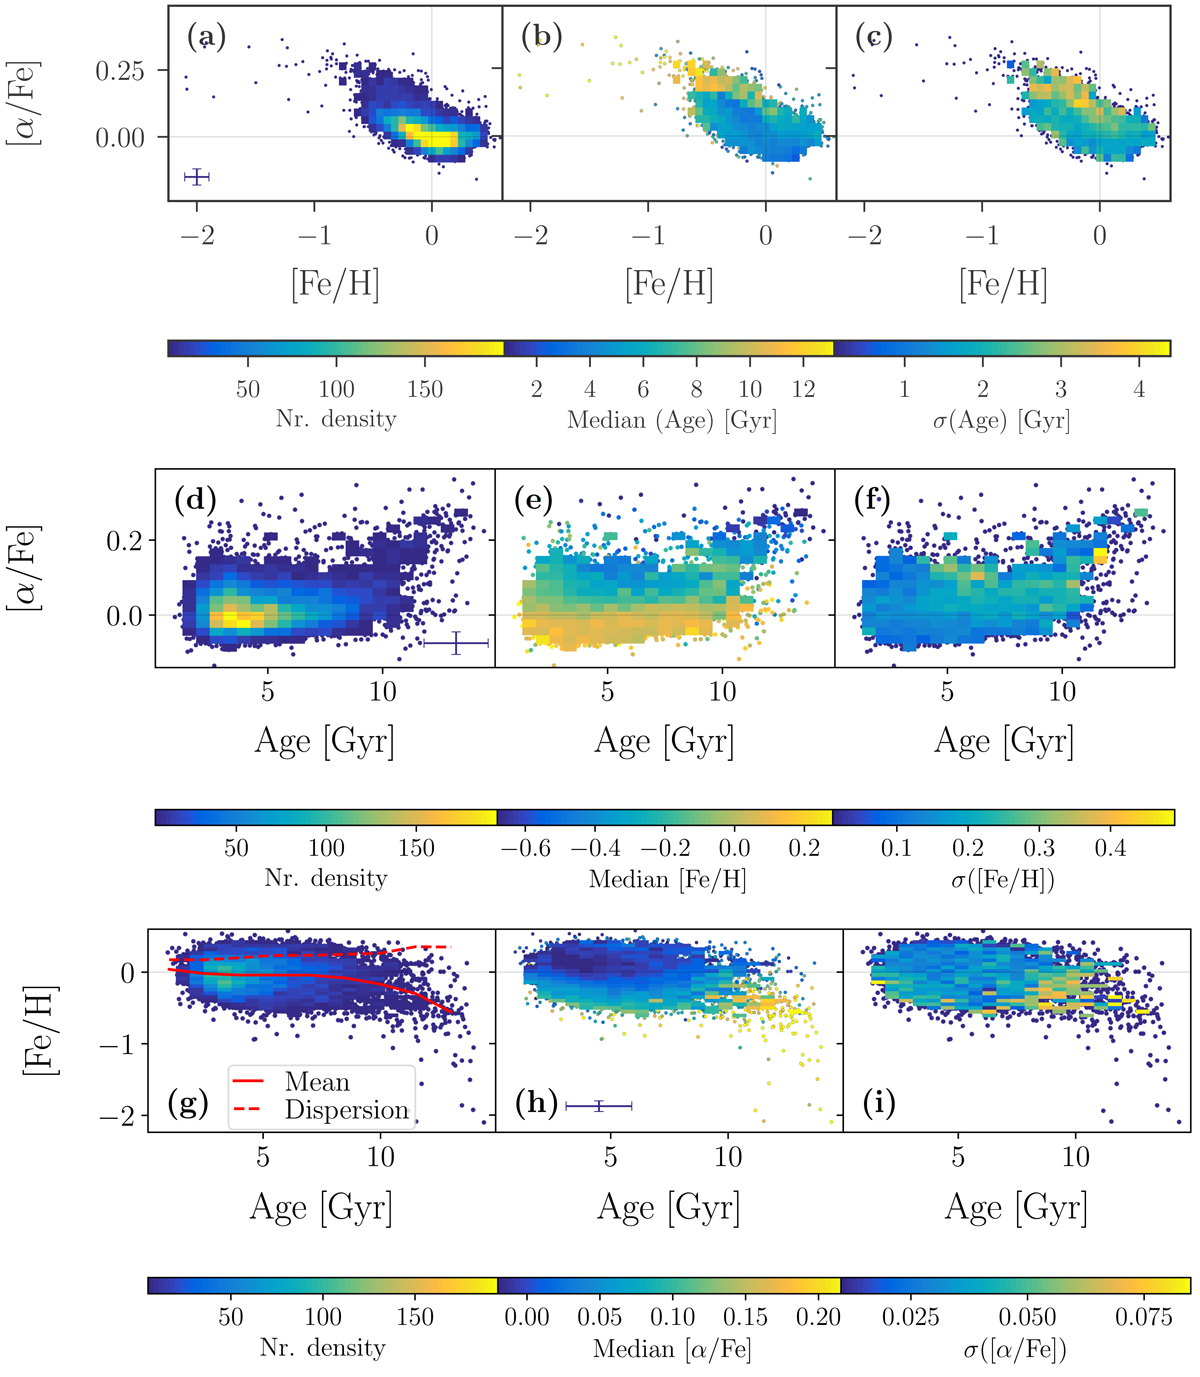
Diagrams of the age-[Fe/H]–[α/Fe] distribution in three rotating visualisations (top to bottom). Panels a–c: [α/Fe] both as a function of [Fe/H]. Panels d–f and g–i: [α/Fe] and [Fe/H] as a function of age, respectively. We show the density distributions in the left panels (a), (d), and (g). The same distributions are shown with bins coloured by the median age, [Fe/H], and [α/Fe] in the middle panels (b), (e), and (h), respectively. Right panels: same distributions coloured by the standard deviation of age, [Fe/H], and [α/Fe] in the middle panels (c), (f), and (i), respectively. Dots are used for individual stars in sparse regimes instead of density bins. In (panel g), we also show the mean metallicity (red line) and dispersion (red dashed line) as a function stellar age. The mean is decreasing with age from 0.04 to −0.56 dex, while the dispersion is increasing with stellar age from 0.17 to 0.35 dex. See text in Sect. 4.2 for detailed discussion.
Current usage metrics show cumulative count of Article Views (full-text article views including HTML views, PDF and ePub downloads, according to the available data) and Abstracts Views on Vision4Press platform.
Data correspond to usage on the plateform after 2015. The current usage metrics is available 48-96 hours after online publication and is updated daily on week days.
Initial download of the metrics may take a while.