Fig. 1.
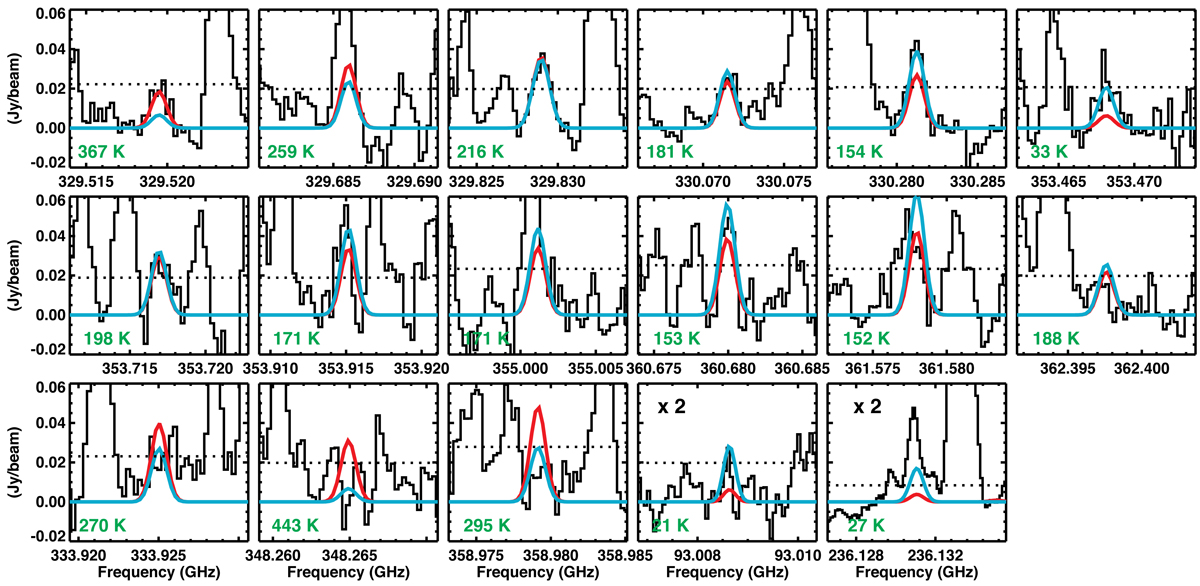
Lines of HONO observed towards the protostar IRAS 16293 B (in black). The first 12 lines are the identified lines of HONO in the ALMA-PILS band 7 survey. On the last row, the first 3 lines correspond to the undetected transitions that are used to constrain the best-fit model and the last two lines are those identified in other ALMA data (see Sect. 3 for more details). The 3σ limit is indicated by a dotted line. The best-fit model with Tex = 100 K is shown in blue, while the model in red corresponds to a higher Tex of 300 K. The spectrum at 93 GHz is extracted at the continuum peak position, given the lower spatial resolution of the data. The column density was multiplied by a factor 2 to take this difference into account (Jørgensen et al. 2016). The upper energy level is indicated in green in the bottom left corner of each panel.
Current usage metrics show cumulative count of Article Views (full-text article views including HTML views, PDF and ePub downloads, according to the available data) and Abstracts Views on Vision4Press platform.
Data correspond to usage on the plateform after 2015. The current usage metrics is available 48-96 hours after online publication and is updated daily on week days.
Initial download of the metrics may take a while.