Fig. 3.
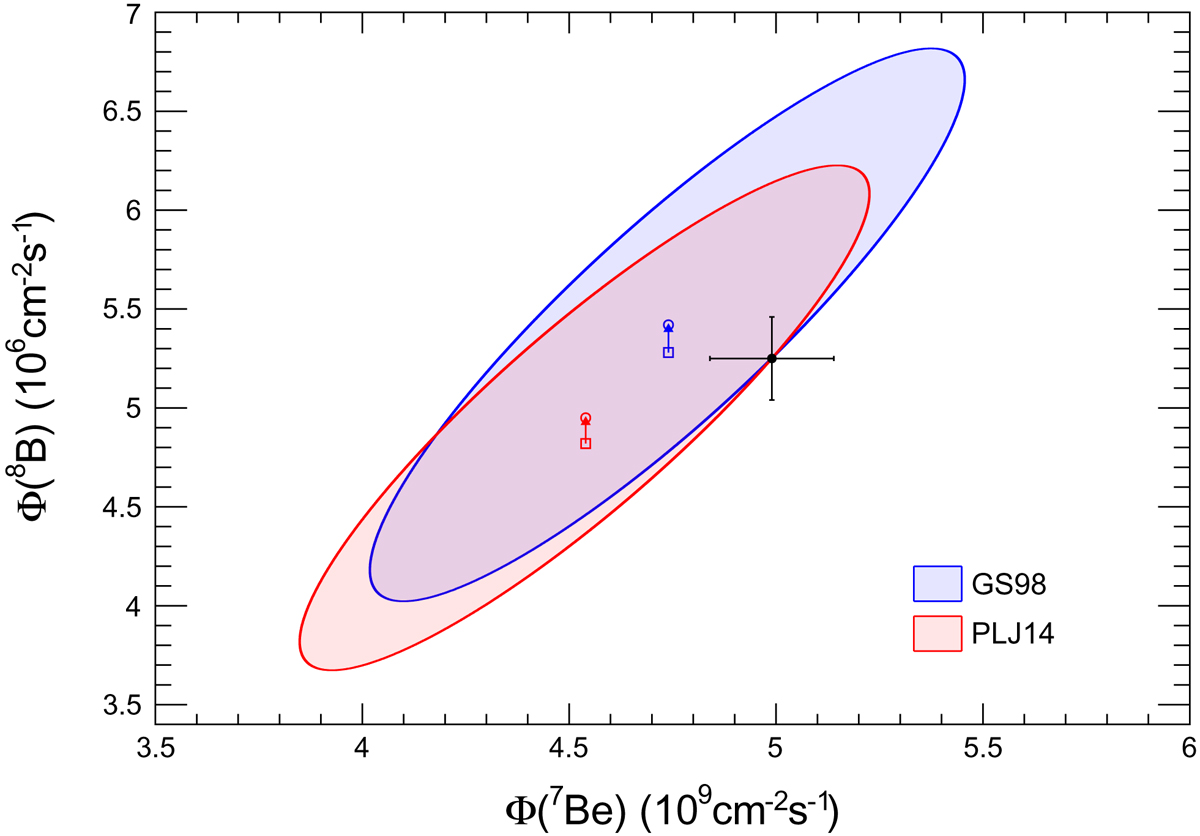
Fluxes of Φ(8B) and Φ(7Be) compared to solar values (Aharmim et al. 2013; Agostini et al. 2018). The black dot and error bars indicate solar values, while the squares and circles indicate the results obtained with the ADE11 electron-capture rate (older) and that of STPB13 (current), respectively. Ellipses denote theoretical 1σ confidence level (C.L.) for 2 degrees of freedom.
Current usage metrics show cumulative count of Article Views (full-text article views including HTML views, PDF and ePub downloads, according to the available data) and Abstracts Views on Vision4Press platform.
Data correspond to usage on the plateform after 2015. The current usage metrics is available 48-96 hours after online publication and is updated daily on week days.
Initial download of the metrics may take a while.