Fig. A.1
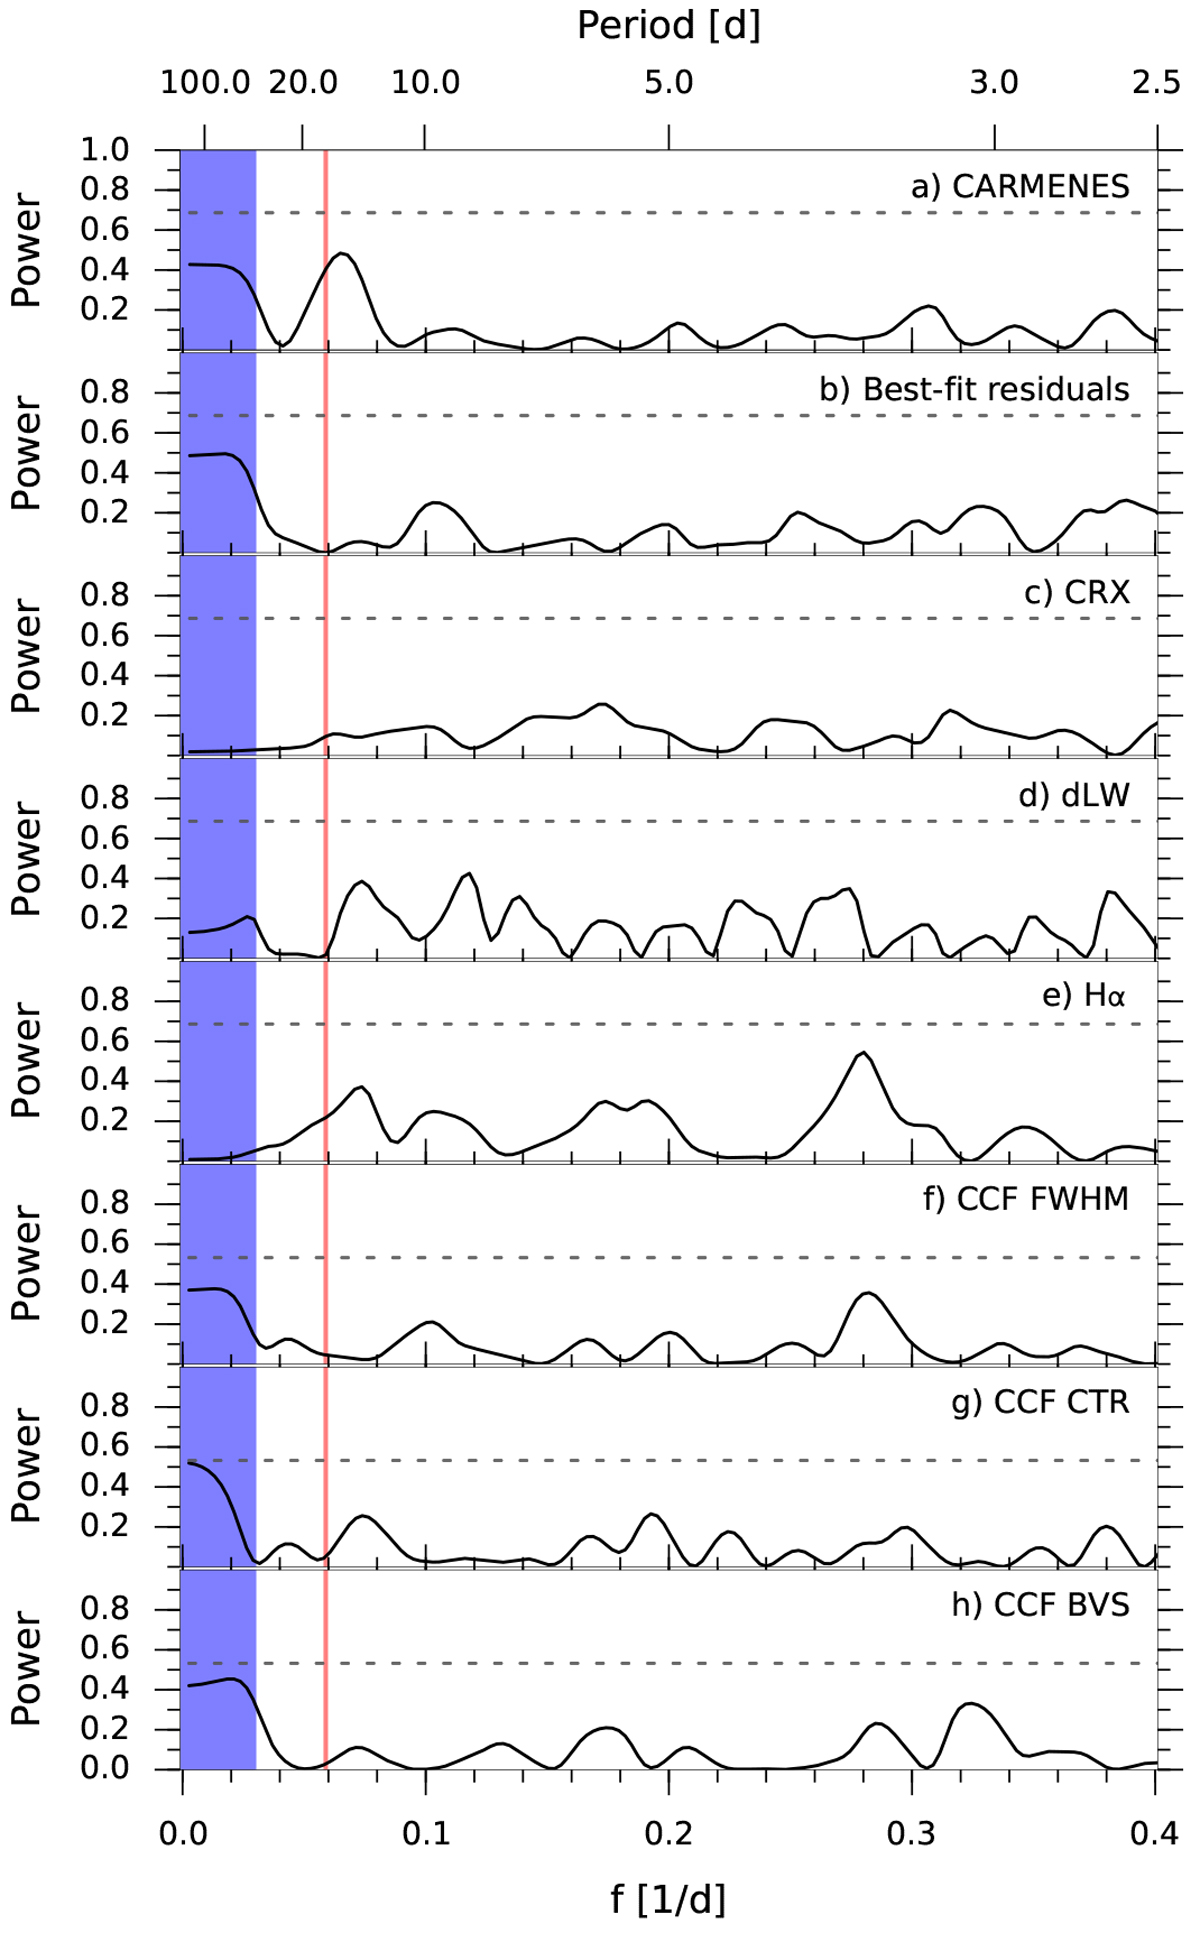
GLS periodograms of CARMENES RVs (panel a) and their residuals (panel b) after removing the planet signal at f = 0.06 d−1 derived fromK2 photometry, marked in red. Panels c–e: periodograms of the chromatic index, differential line width, and Hα index. Panels f–h: periodograms for the cross-correlation function full-width half-maximum, contrast, and bisector velocity span. The horizontal dashed line shows the theoretical FAP level of 10%. The shaded blue area indicates the period range longerthan the time span of the observations.
Current usage metrics show cumulative count of Article Views (full-text article views including HTML views, PDF and ePub downloads, according to the available data) and Abstracts Views on Vision4Press platform.
Data correspond to usage on the plateform after 2015. The current usage metrics is available 48-96 hours after online publication and is updated daily on week days.
Initial download of the metrics may take a while.