Free Access
Fig. 2
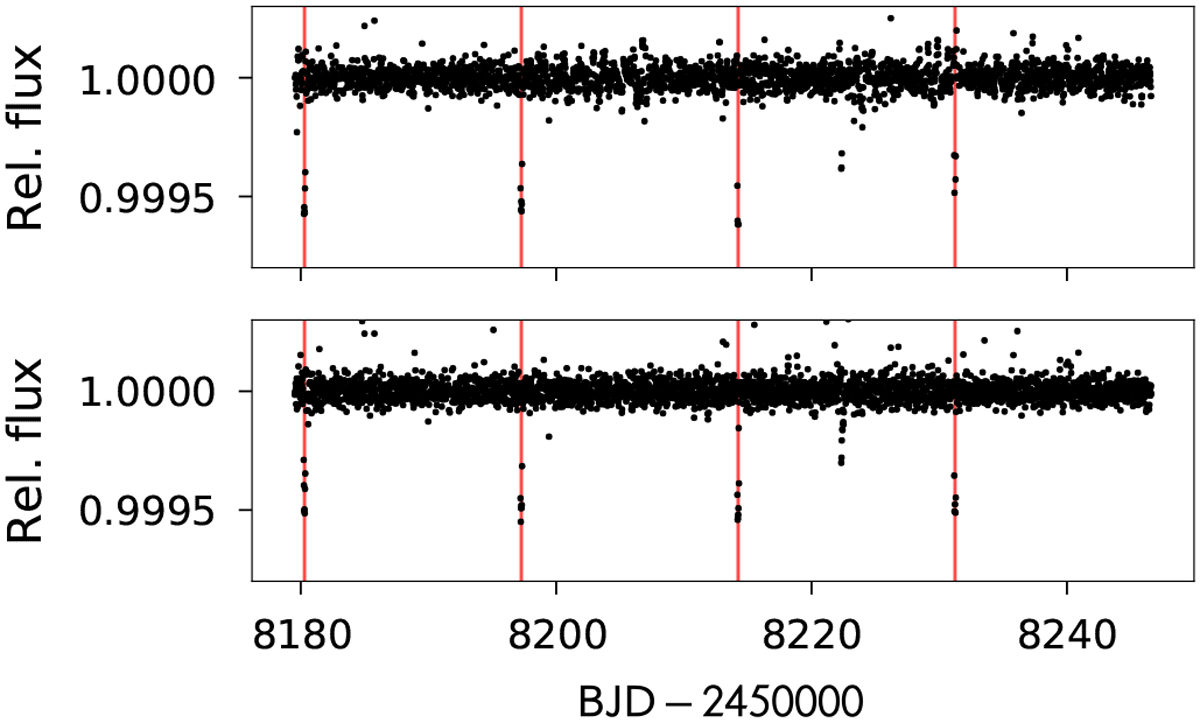
Detrended K2 light curves of K2-292 using the two methods described in Sect. 2. Top panel: Dai et al. (2017) method à la Vanderburg & Johnson (2014). Bottom panel: Pallé et al. (2019) method based on the Everest pipeline (Luger et al. 2018). The vertical red lines mark the position of each detected transit.
Current usage metrics show cumulative count of Article Views (full-text article views including HTML views, PDF and ePub downloads, according to the available data) and Abstracts Views on Vision4Press platform.
Data correspond to usage on the plateform after 2015. The current usage metrics is available 48-96 hours after online publication and is updated daily on week days.
Initial download of the metrics may take a while.