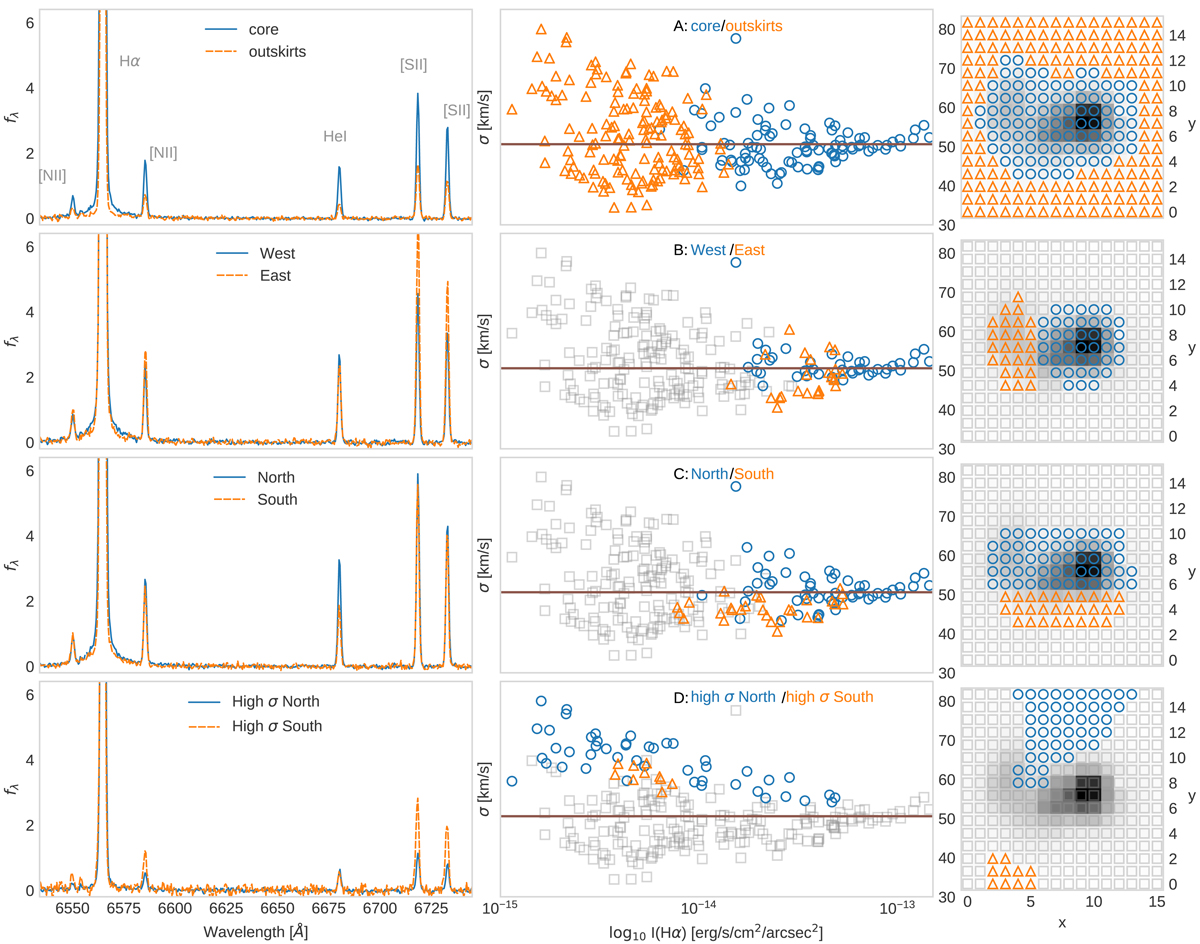
Fig. 5.

Left column: Averaged spectra for different spatial regions, in arbitrary flux density units, scaled to match in Hα equivalent width. The continuum has been subtracted from both the blue and orange spectra, enabling comparison between panels in different rows. Middle column: Intensity-velocity dispersion diagrams for Hα. The horizontal line in each panel is 〈σm〉. Markers are color-coded by the spatial location of their corresponding spaxels, shown in the right column. We note that the y-axis values are di played on the right-hand side. Right column: Spatial maps of Hα, identifying the different regions. North is up, east is to the left.
Current usage metrics show cumulative count of Article Views (full-text article views including HTML views, PDF and ePub downloads, according to the available data) and Abstracts Views on Vision4Press platform.
Data correspond to usage on the plateform after 2015. The current usage metrics is available 48-96 hours after online publication and is updated daily on week days.
Initial download of the metrics may take a while.


