Fig. 4.
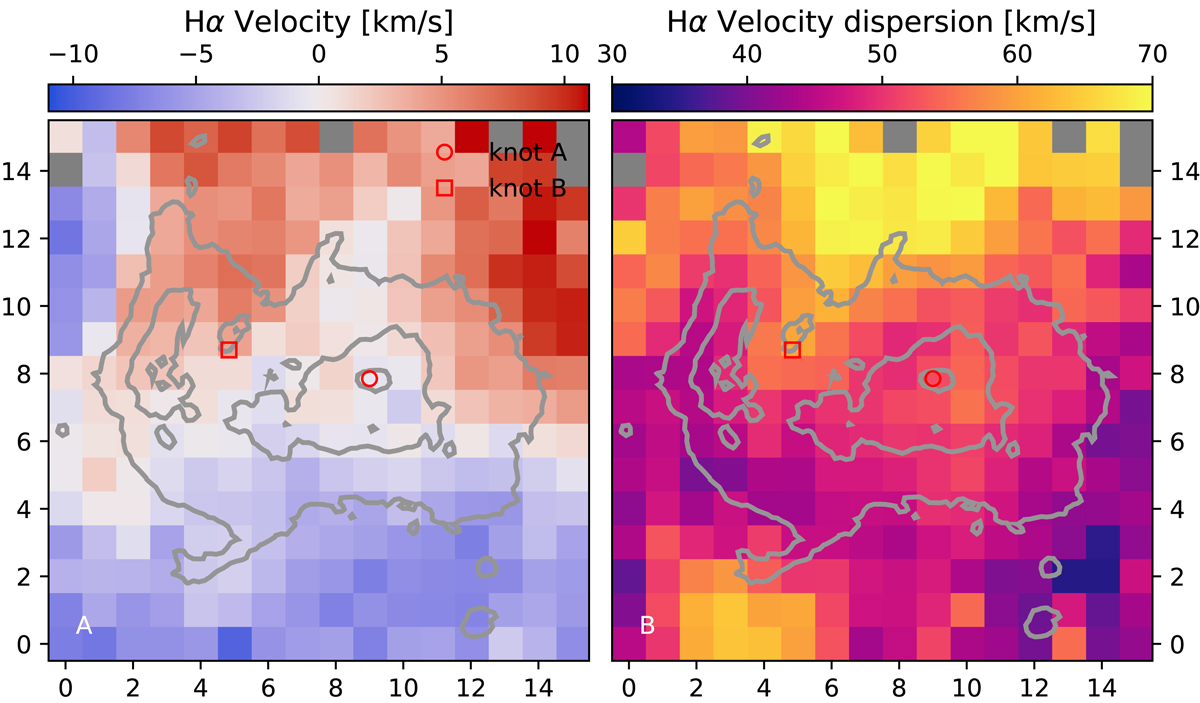
(A): Hα radial velocity distribution around the luminosity-weighted average velocity zero-point of 95.34 km s−1. HST Hα countours are overplotted in gray solid lines, with the outer most (faintest) contour tracing the 1.9 × 10⁻⁷ erg s cm−2 Å arcsec−2 iso-intensity level. (B): Hα velocity dispersion, corrected only for instrumental broadening. Only spaxels with S/N ≥ 10 are shown. The gray spaxels at positions (0,14) and (8,15) are dead fibers.
Current usage metrics show cumulative count of Article Views (full-text article views including HTML views, PDF and ePub downloads, according to the available data) and Abstracts Views on Vision4Press platform.
Data correspond to usage on the plateform after 2015. The current usage metrics is available 48-96 hours after online publication and is updated daily on week days.
Initial download of the metrics may take a while.