Fig. 3.
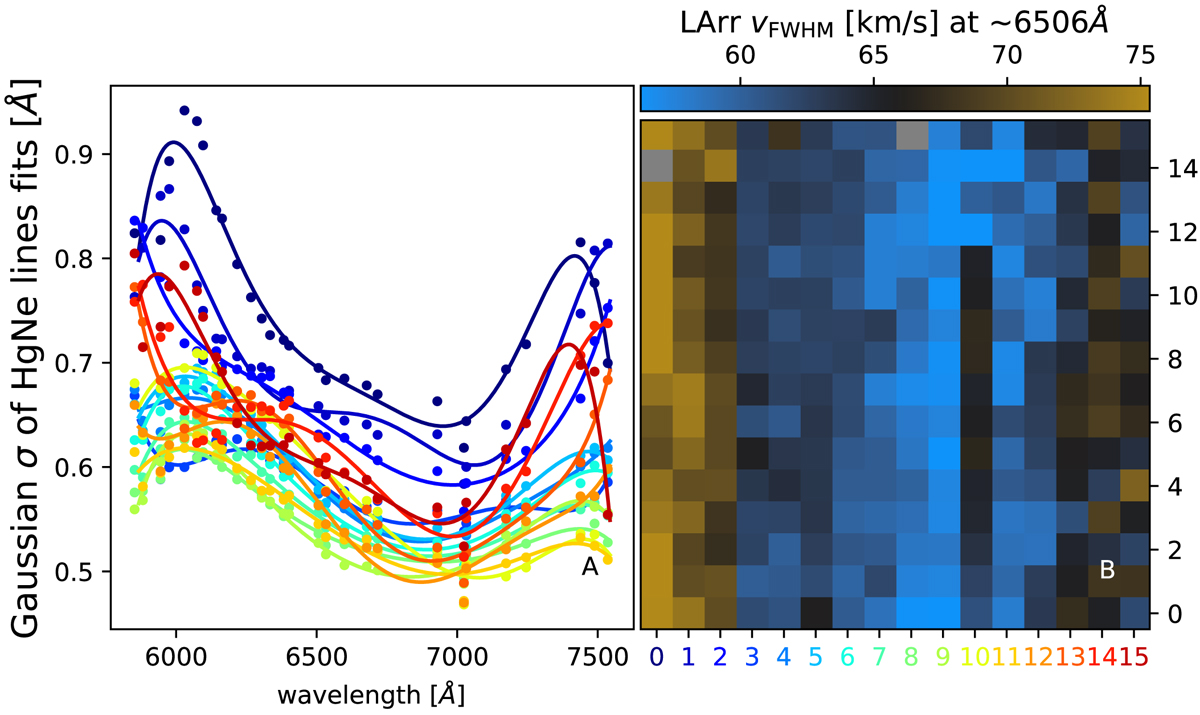
(A) Instrumental broadening for 26 HgNe arc lines (filled circles), here for representation purposes obtained by stacking the spectra along columns in (B). The data points and the ID of the column that produced them have the same color-coding. The colored solid lines are a sixth order polynomial fit, used to interpolate the resolving power at the desired wavelength. (B): An example resolving power map close to Hα. The x-axis shows the column ID, color-coded as in (A).
Current usage metrics show cumulative count of Article Views (full-text article views including HTML views, PDF and ePub downloads, according to the available data) and Abstracts Views on Vision4Press platform.
Data correspond to usage on the plateform after 2015. The current usage metrics is available 48-96 hours after online publication and is updated daily on week days.
Initial download of the metrics may take a while.