Fig. 2.
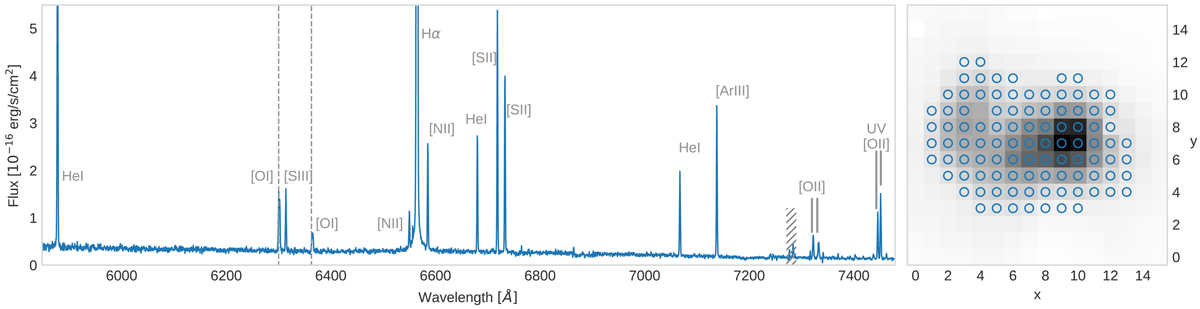
Sky-subtracted and flux-calibrated average spectrum from the PMAS data cube (left panel) of the region marked in the Hα intensity map (blue circles in right panel, at the center of each spaxel). All identified lines are labeled, including the UV [O II] second order spectrum. The sky emission at [O I] λλ6300, 6363 (gray dashed lines) could not be fully subtracted with the sky exposure. The y-axis is truncated in order to better show weak lines like [O II] λλ7320, 7330. Vignetting affects the regions λ ≲ 6175 Å and λ ≳ 7300 Å at the edges of the detector (columns x = 0 and x = 15).
Current usage metrics show cumulative count of Article Views (full-text article views including HTML views, PDF and ePub downloads, according to the available data) and Abstracts Views on Vision4Press platform.
Data correspond to usage on the plateform after 2015. The current usage metrics is available 48-96 hours after online publication and is updated daily on week days.
Initial download of the metrics may take a while.