Fig. 13.
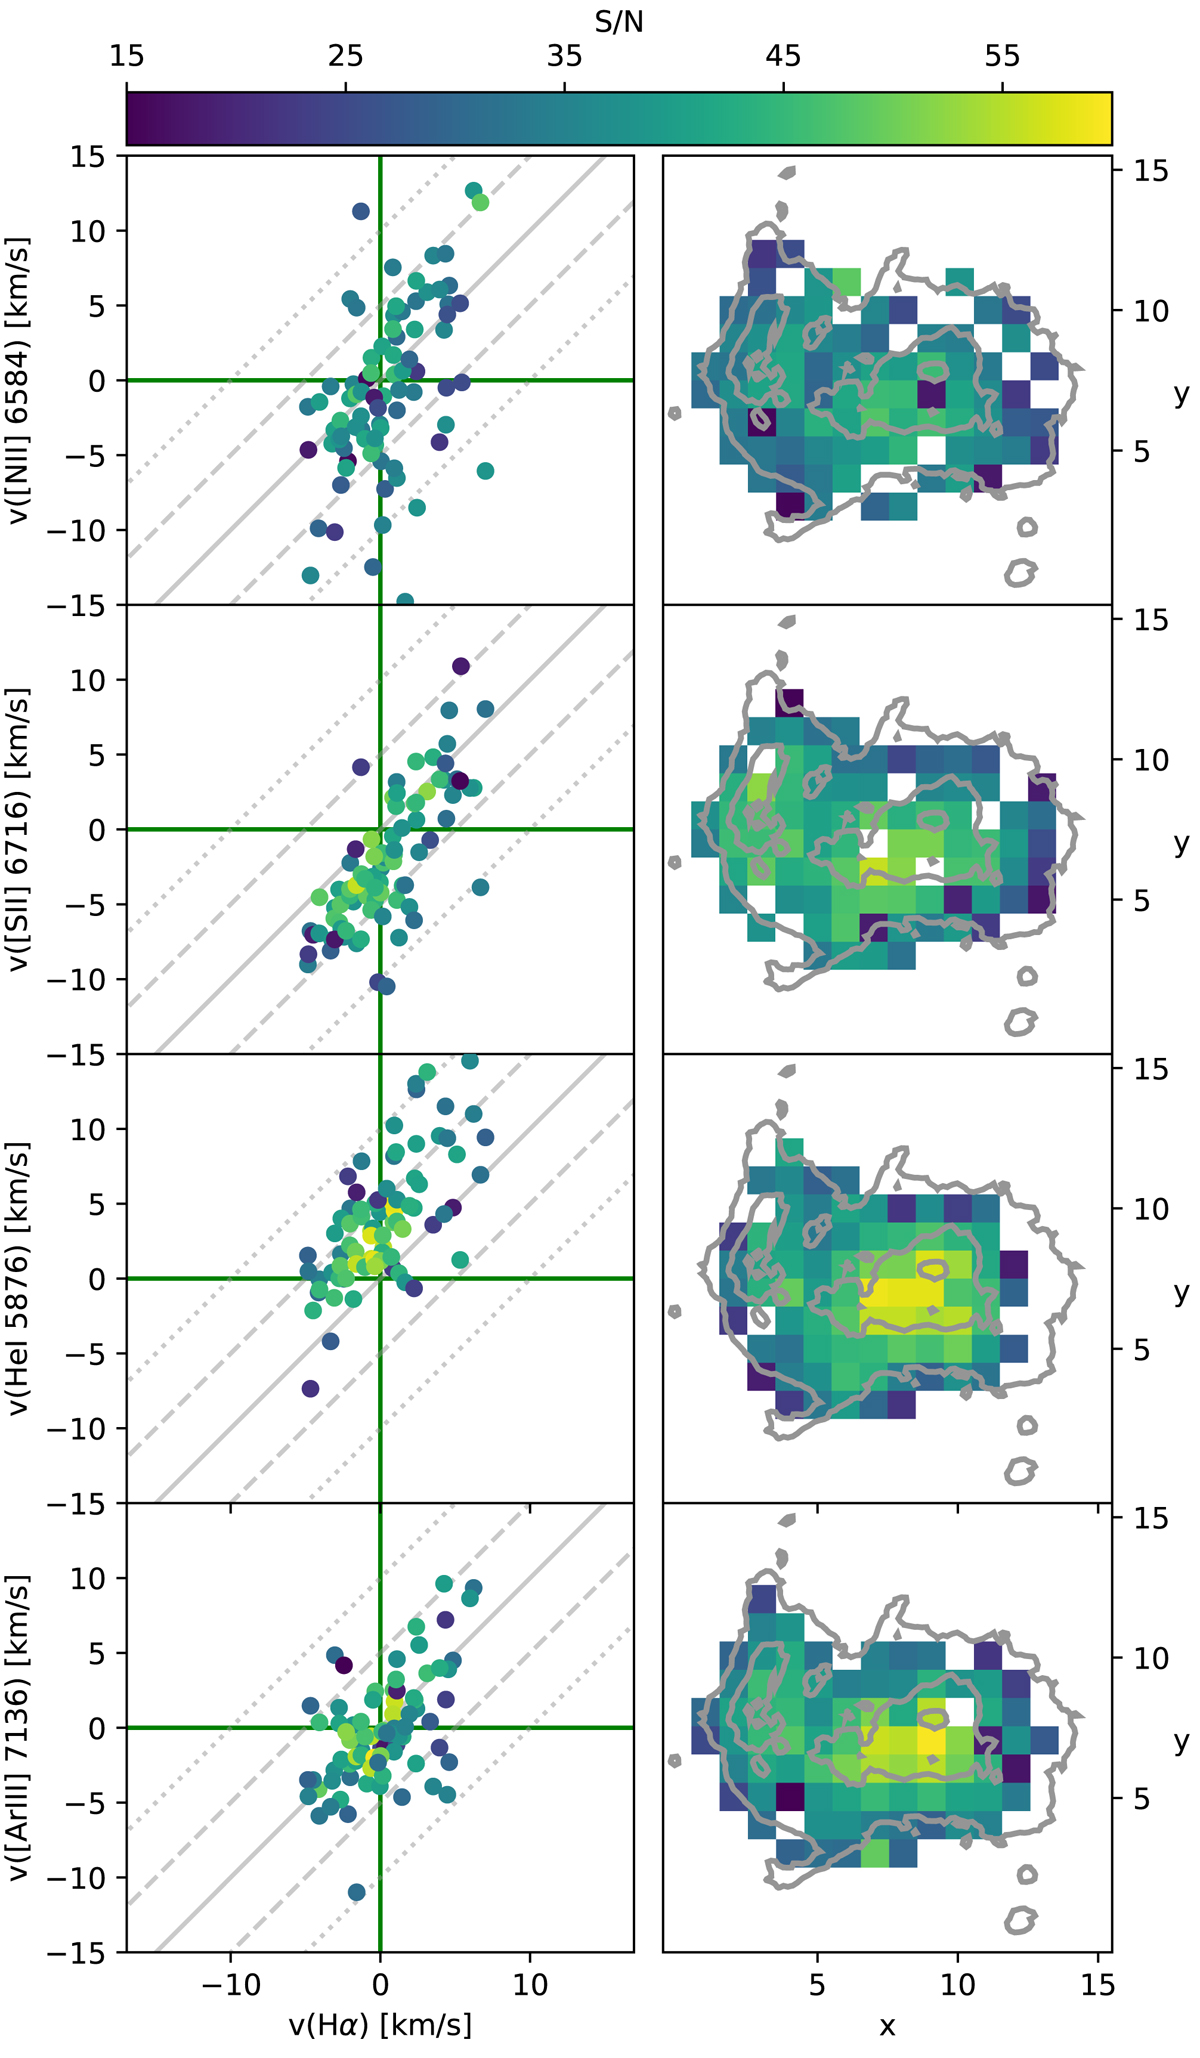
Left panel: Hα radial velocity as a function of the radial velocity in lines tracing low-ionization ([N II], [S II]) and high-ionization gas (He I, [Ar III]). The points are color-coded by S/N. The 1:1 Hα velocity line (solid gray), with ±5 (dashed) and ±10 km s−1 (dotted) lines, are plotted for orientation. Only spaxels with S/N ≥ 15 or within the overplotted contours in the right panel are shown. Right panel: spatial distribution of the spaxels, color-coded by S/N.
Current usage metrics show cumulative count of Article Views (full-text article views including HTML views, PDF and ePub downloads, according to the available data) and Abstracts Views on Vision4Press platform.
Data correspond to usage on the plateform after 2015. The current usage metrics is available 48-96 hours after online publication and is updated daily on week days.
Initial download of the metrics may take a while.