Fig. 11.
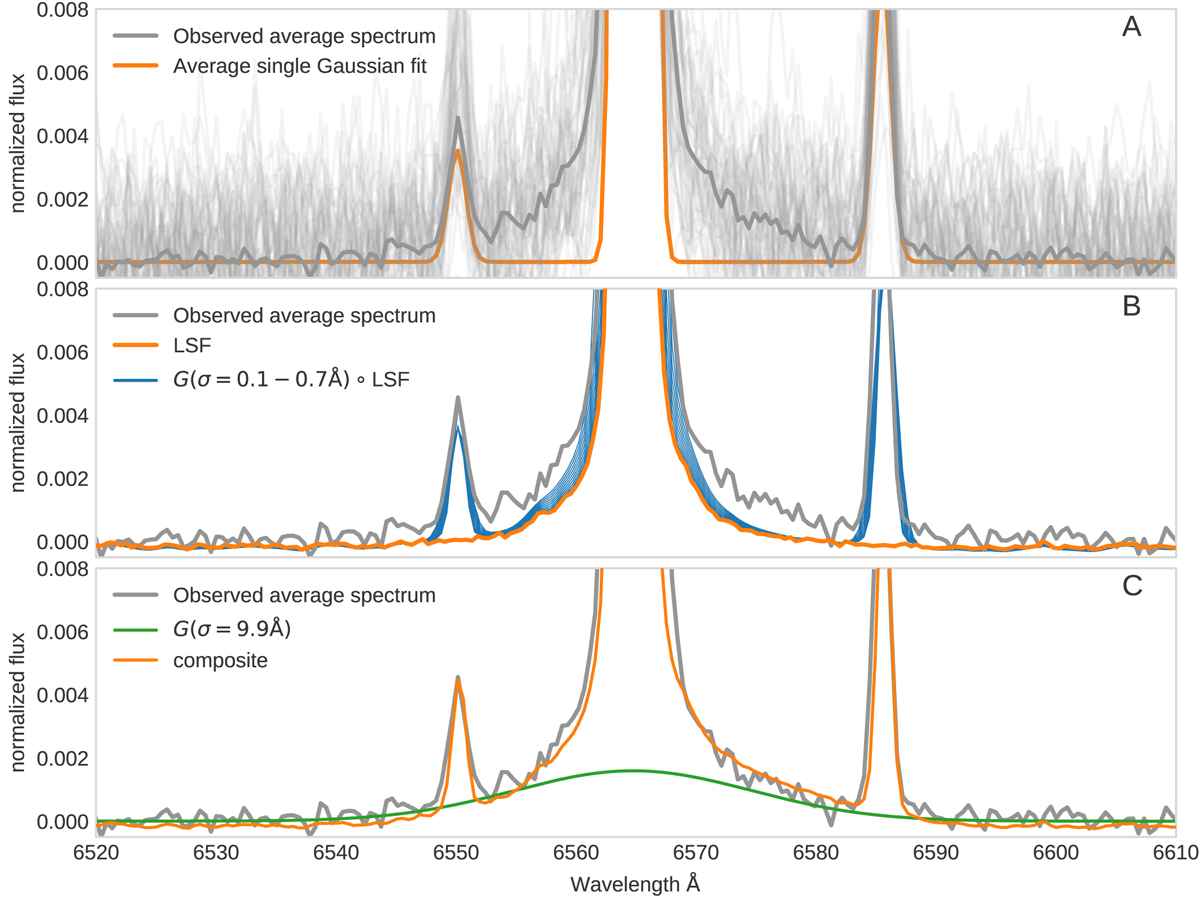
west region average-stacked observed spectrum (thick gray line) around Hα, compared to (A) average-stacked single Gaussian models (orange line) and individual observed spectra (thin gray lines); (B) Empirical LSF (orange line) and LSF-convolved single Gaussian of various widths (blue lines); (C) composite model (orange line) of a broad Gaussian (green line) added to an LSF-convolved narrow Gaussian of width σ = 0.7 Å.
Current usage metrics show cumulative count of Article Views (full-text article views including HTML views, PDF and ePub downloads, according to the available data) and Abstracts Views on Vision4Press platform.
Data correspond to usage on the plateform after 2015. The current usage metrics is available 48-96 hours after online publication and is updated daily on week days.
Initial download of the metrics may take a while.