Free Access
Fig. 5.
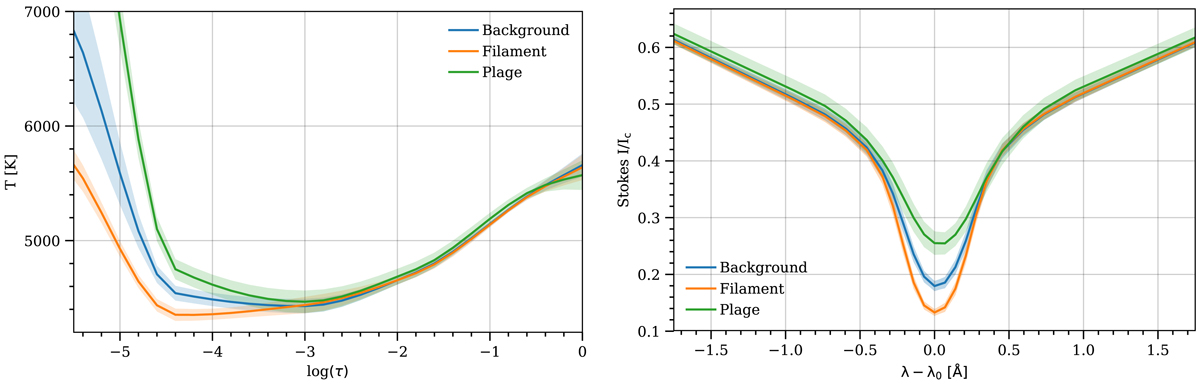
Left panel: temperature stratification calculated from the average of the temperature inferred from profiles of different regions. Right panel: average Stokes I profile of the selected regions. The colored bands of each curve indicate the standard deviation of each set of profiles.
Current usage metrics show cumulative count of Article Views (full-text article views including HTML views, PDF and ePub downloads, according to the available data) and Abstracts Views on Vision4Press platform.
Data correspond to usage on the plateform after 2015. The current usage metrics is available 48-96 hours after online publication and is updated daily on week days.
Initial download of the metrics may take a while.