Fig. 3.
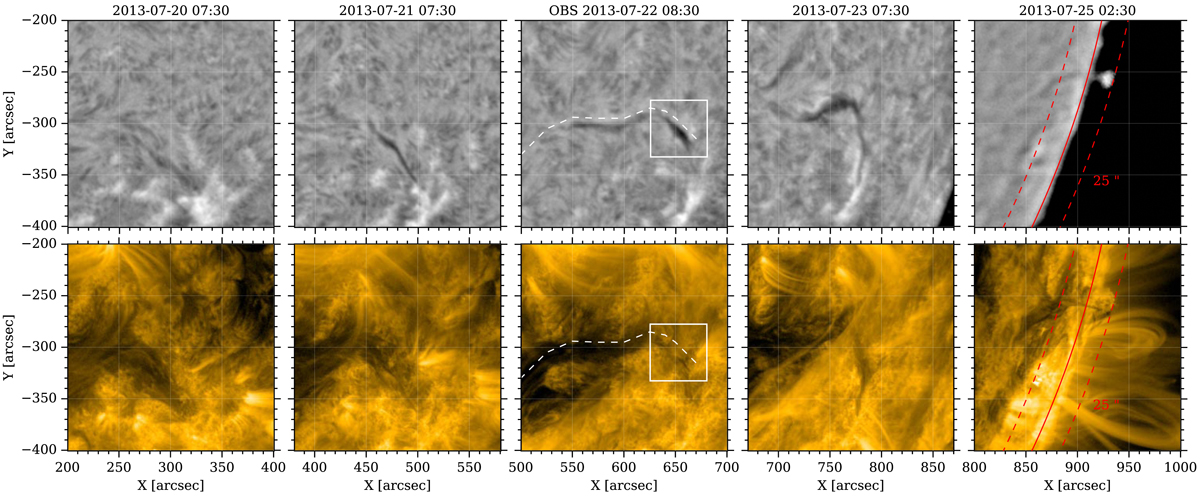
Evolution of the filament during five days. We see how the filament is increasing its absorption and its size (up to 100″ long) during its evolution. Top row: images from GONG and bottom row: same area but in the channel 171 Å of AIA. A dashed white line indicates the shape of the whole structure visually estimated from the combination of both filters.
Current usage metrics show cumulative count of Article Views (full-text article views including HTML views, PDF and ePub downloads, according to the available data) and Abstracts Views on Vision4Press platform.
Data correspond to usage on the plateform after 2015. The current usage metrics is available 48-96 hours after online publication and is updated daily on week days.
Initial download of the metrics may take a while.