Fig. 13.
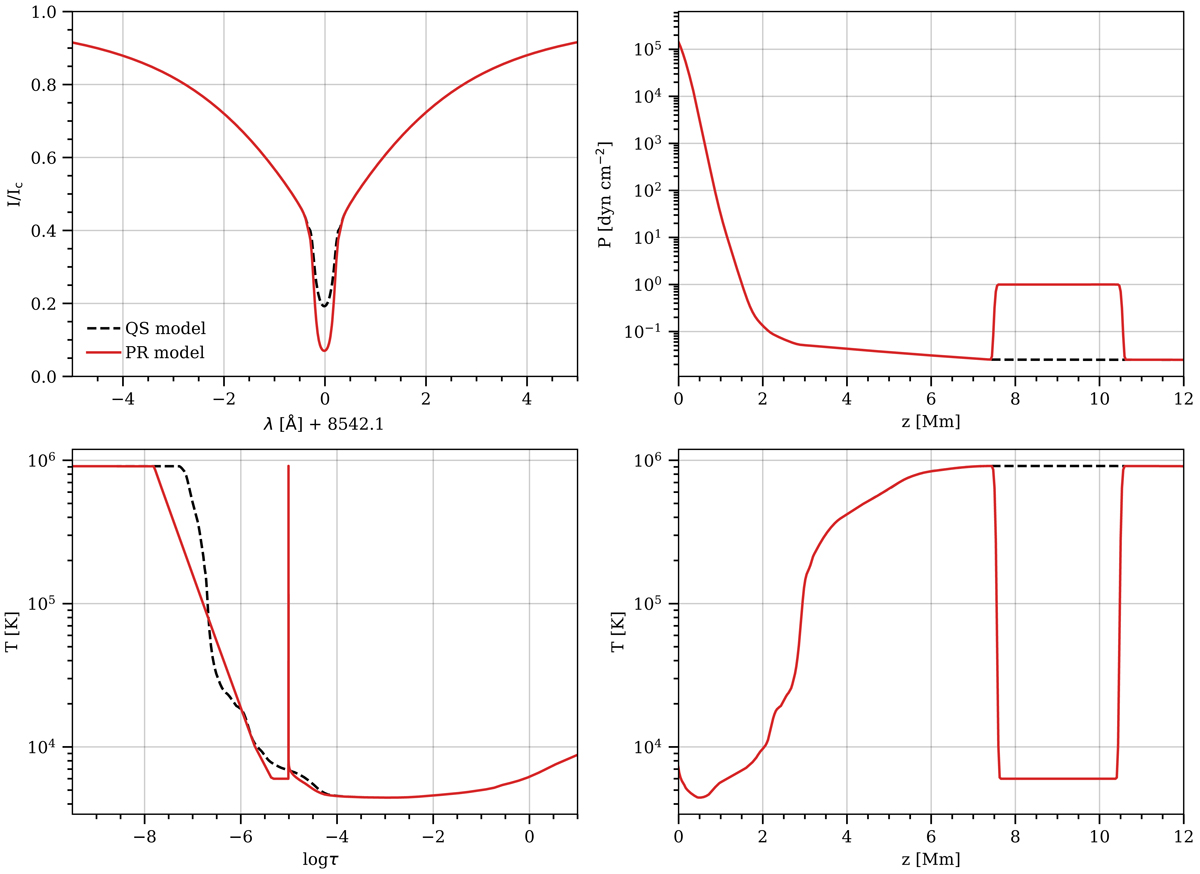
Upper left panel: Stokes I profile generated from two different atmospheres, a QS model (dashed black line) and a prominence above it (red solid line). Upper right panel: gas pressure in geometrical height scale. Lower left panel: temperature in optical depth scale. Lower right panel: temperature in geometrical height scale.
Current usage metrics show cumulative count of Article Views (full-text article views including HTML views, PDF and ePub downloads, according to the available data) and Abstracts Views on Vision4Press platform.
Data correspond to usage on the plateform after 2015. The current usage metrics is available 48-96 hours after online publication and is updated daily on week days.
Initial download of the metrics may take a while.