Free Access
Fig. 9
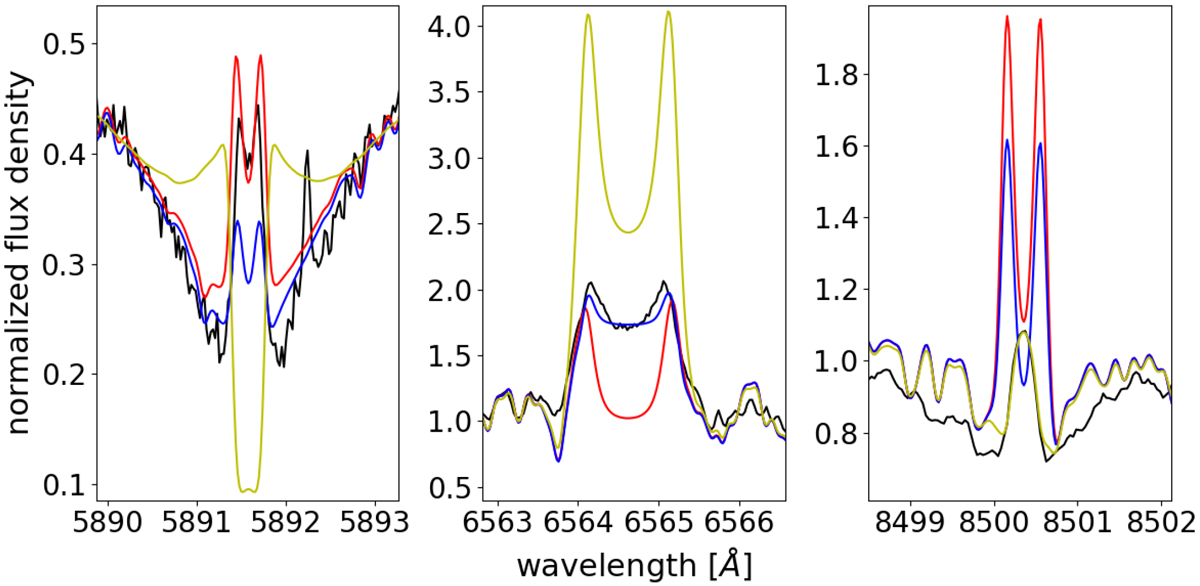
Comparison of the observed median activity spectrum of TYC 3529-1437-1 (black) as given by ICa IRT to the model spectrum fitting best in a single line. Best-fit models using only Na I D2 are denoted in red (model #078), using only Hα in blue (model #073), and Ca II IRT in yellow (model #157).
Current usage metrics show cumulative count of Article Views (full-text article views including HTML views, PDF and ePub downloads, according to the available data) and Abstracts Views on Vision4Press platform.
Data correspond to usage on the plateform after 2015. The current usage metrics is available 48-96 hours after online publication and is updated daily on week days.
Initial download of the metrics may take a while.