Fig. 8
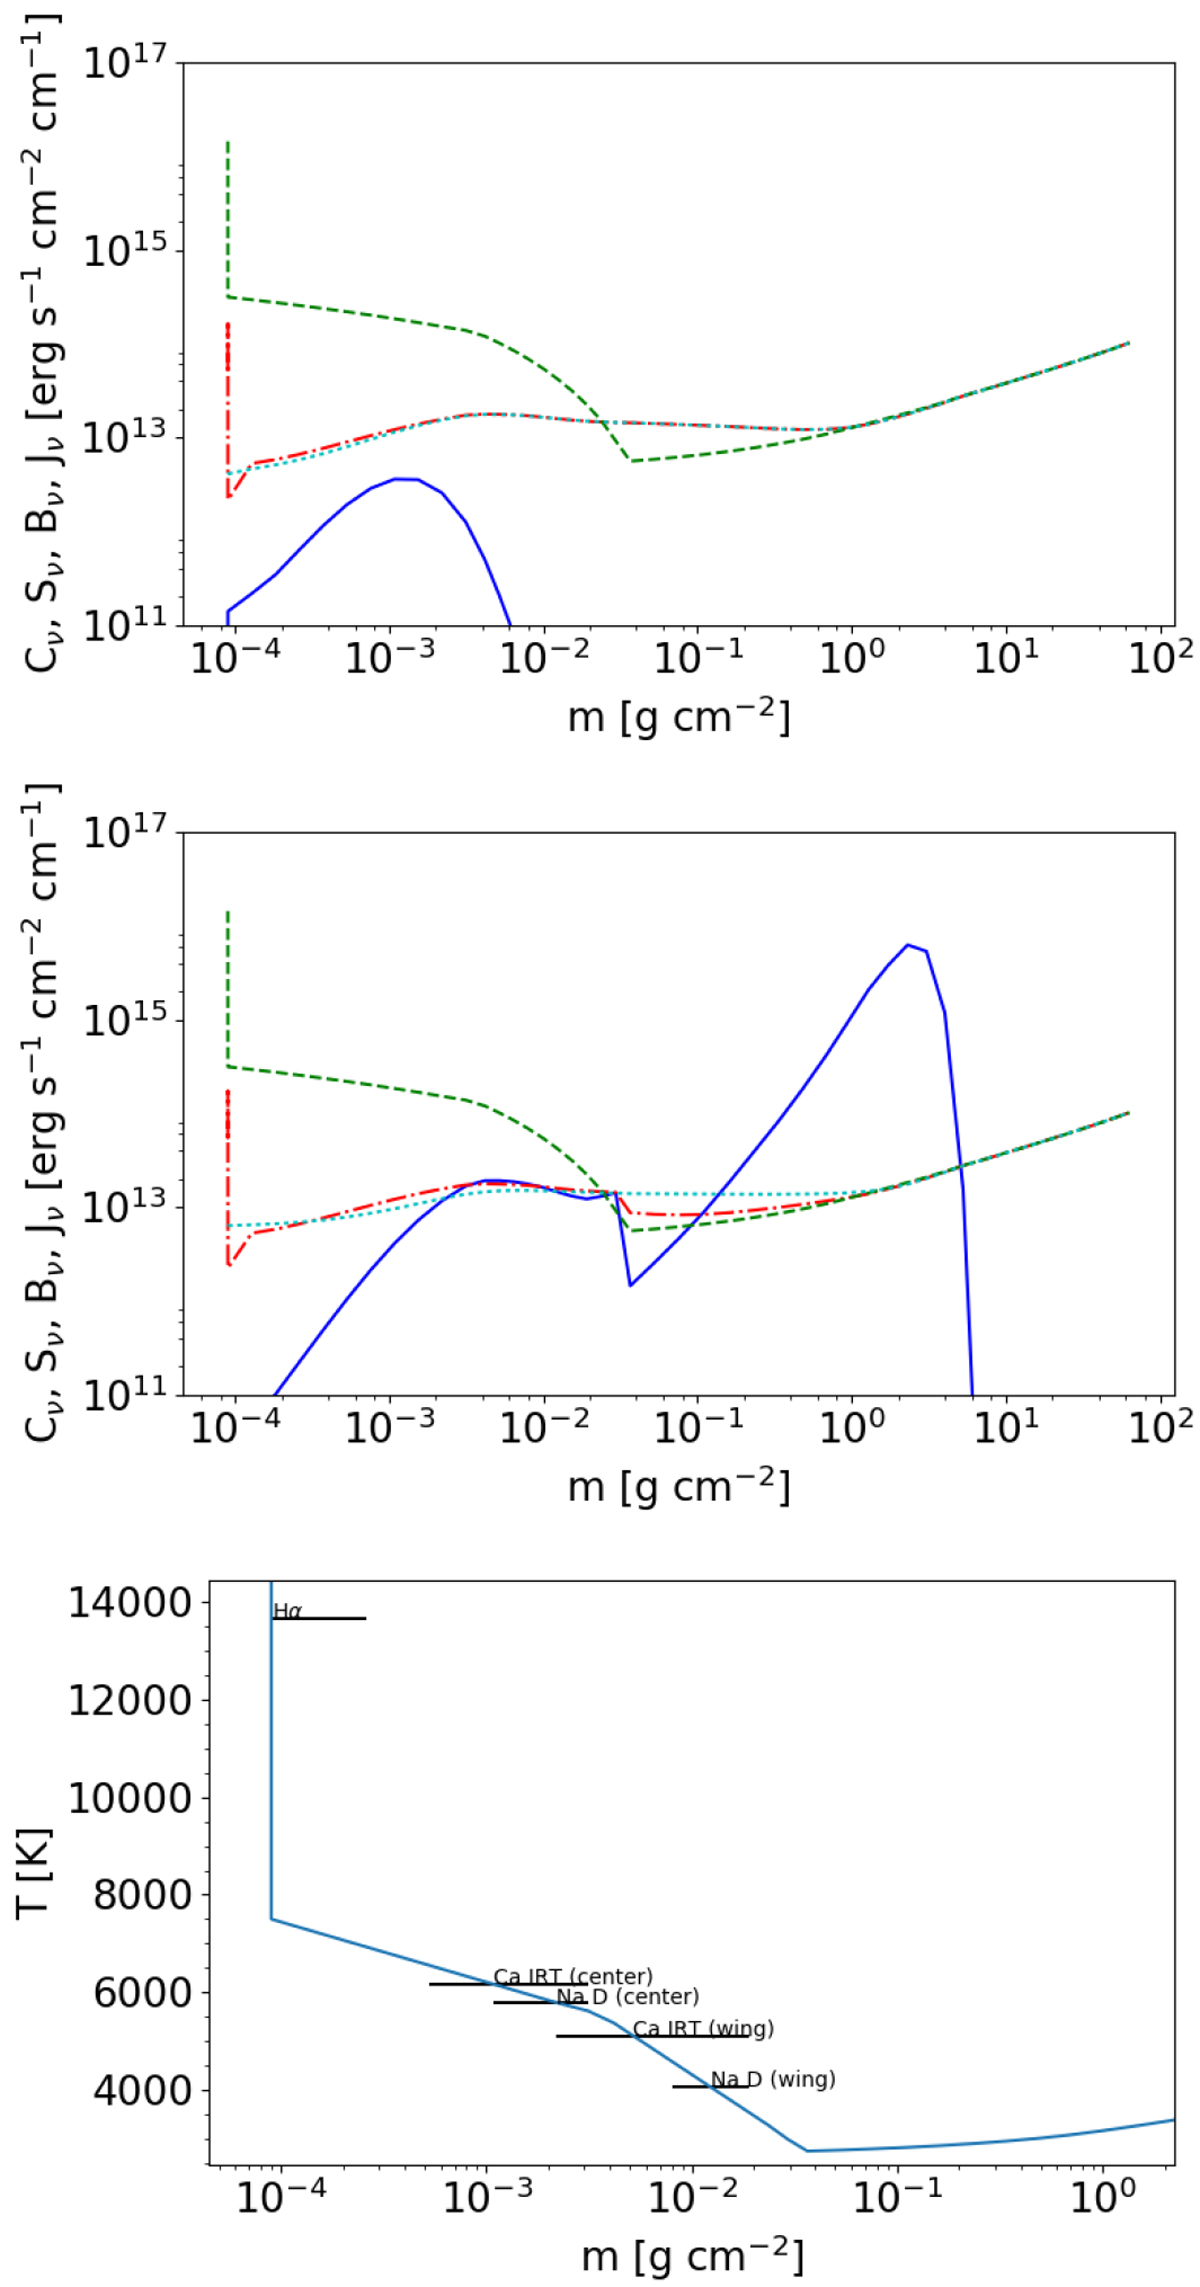
Upper and middle panels: scaled flux contribution function Cν (solid blue), source function Sν (dash-dotted red), Planck function Bν (dashed green), and intensity Jν (dotted cyan) for λ = 8500.36 Å representing the line core (upper panel) and λ = 8500.54 Å in the line wing (mid-panel) of the Ca II IRT line in model #080. The peak at high column mass in the contribution function of the line wing shows that the photospheric flux already dominates at this wavelength but there is still some chromospheric contribution. Lower panel: temperature structure of model #080 and the formation regions of Na I D2, Hα, and the bluest Ca II IRT line.
Current usage metrics show cumulative count of Article Views (full-text article views including HTML views, PDF and ePub downloads, according to the available data) and Abstracts Views on Vision4Press platform.
Data correspond to usage on the plateform after 2015. The current usage metrics is available 48-96 hours after online publication and is updated daily on week days.
Initial download of the metrics may take a while.