Fig. 7
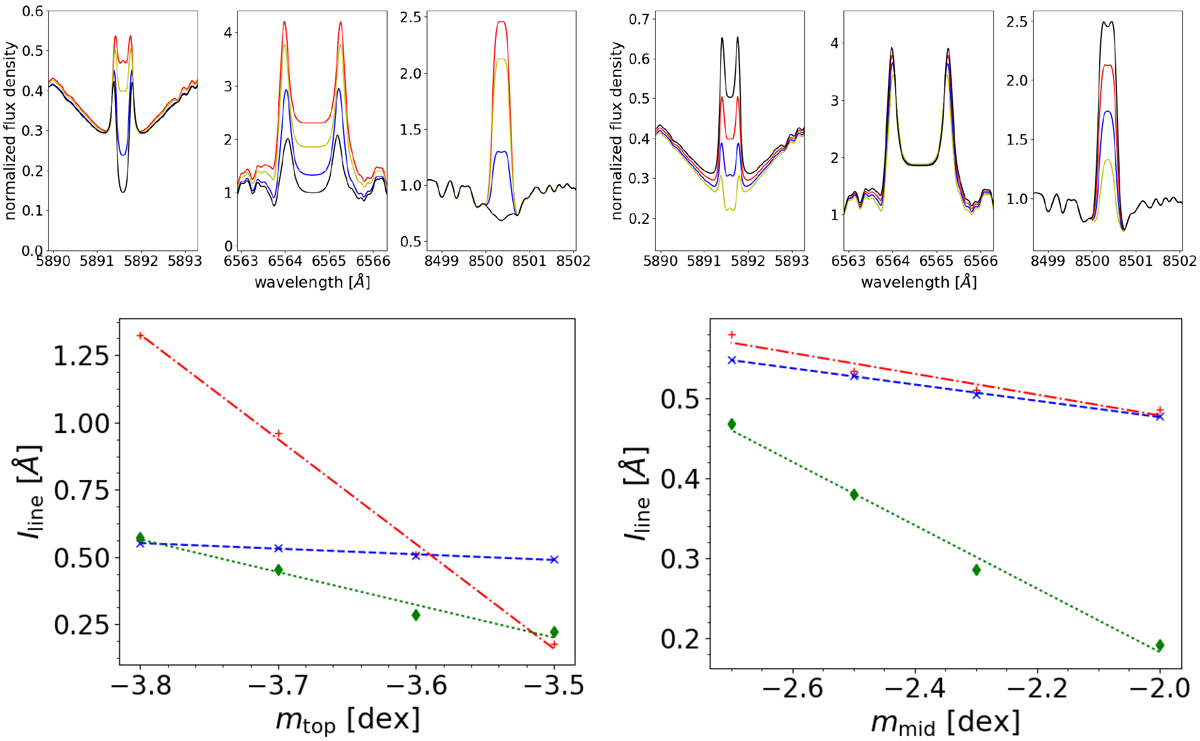
Top panels, left-hand side: sequence of model spectra varying only the parameter mtop from −4.0 to − 3.5 dex, the models are: #136 (black), #137 (blue), #138 (yellow), and #139 (red). Top panels, right-hand side: sequence for the parameter mmid varying from −2.7 to −2.0 dex, models: #121 (yellow), #126 (blue), #138 (red), and #153 (black). Bottom panels: corresponding values of Iline against mtop for Na I D (blue crosses), Hα (red pluses), and Ca II IRT (green diamonds) for the top panels. Additionally the linear fits are plotted: the Na I D fit is plotted by the blue dashed line, the Hα fit by the red dash-dotted line, and the Ca II IRT fit by the green dotted line.
Current usage metrics show cumulative count of Article Views (full-text article views including HTML views, PDF and ePub downloads, according to the available data) and Abstracts Views on Vision4Press platform.
Data correspond to usage on the plateform after 2015. The current usage metrics is available 48-96 hours after online publication and is updated daily on week days.
Initial download of the metrics may take a while.