Fig. 6
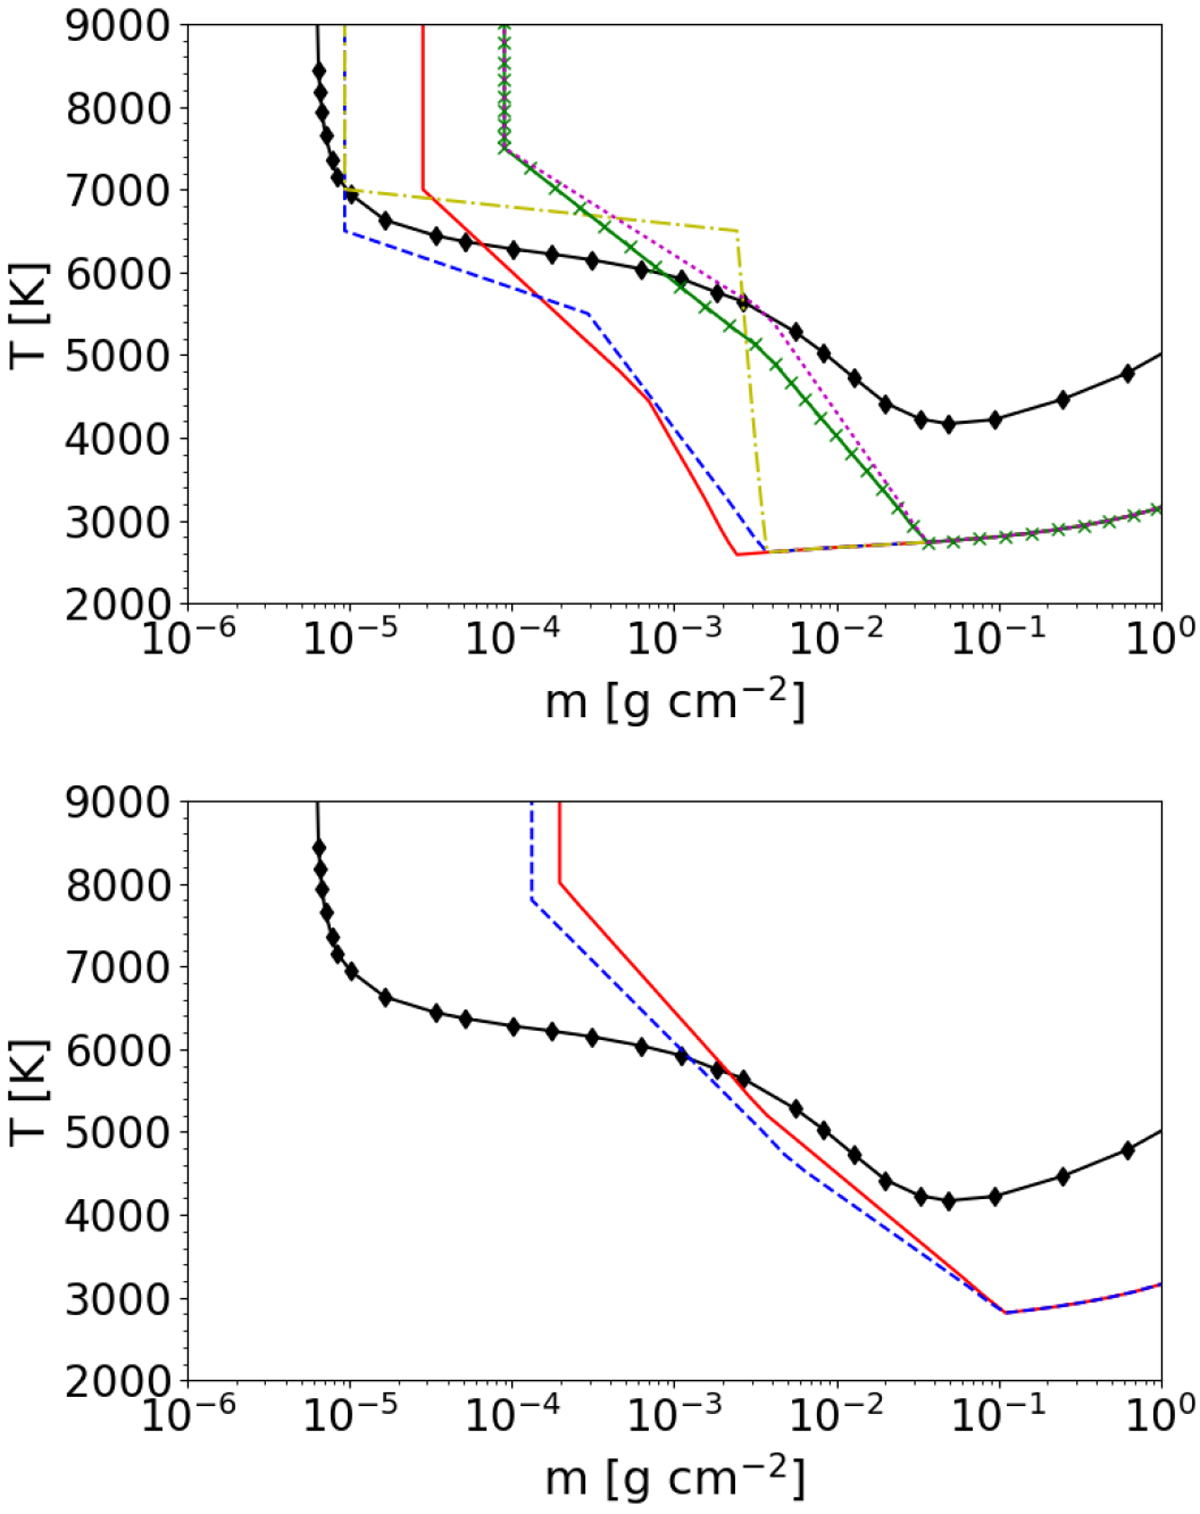
Upper panel: temperature structure of the best single-component fits for the inactive stars as listed in Table A.1. Model #029 is shown by the red solid line, #042 by the blue dashed line, #047 by the yellow dash-dotted line, #079 by the green crossed line, and #080 by the magenta dotted line. Lower panel: same as in the upper panel for the active stars. Model #131 is plotted by the red solid line and #136 by the blue dashed line. The black solid diamond line shows the VAL C model for the Sun (Vernazza et al. 1981).
Current usage metrics show cumulative count of Article Views (full-text article views including HTML views, PDF and ePub downloads, according to the available data) and Abstracts Views on Vision4Press platform.
Data correspond to usage on the plateform after 2015. The current usage metrics is available 48-96 hours after online publication and is updated daily on week days.
Initial download of the metrics may take a while.