Fig. 2
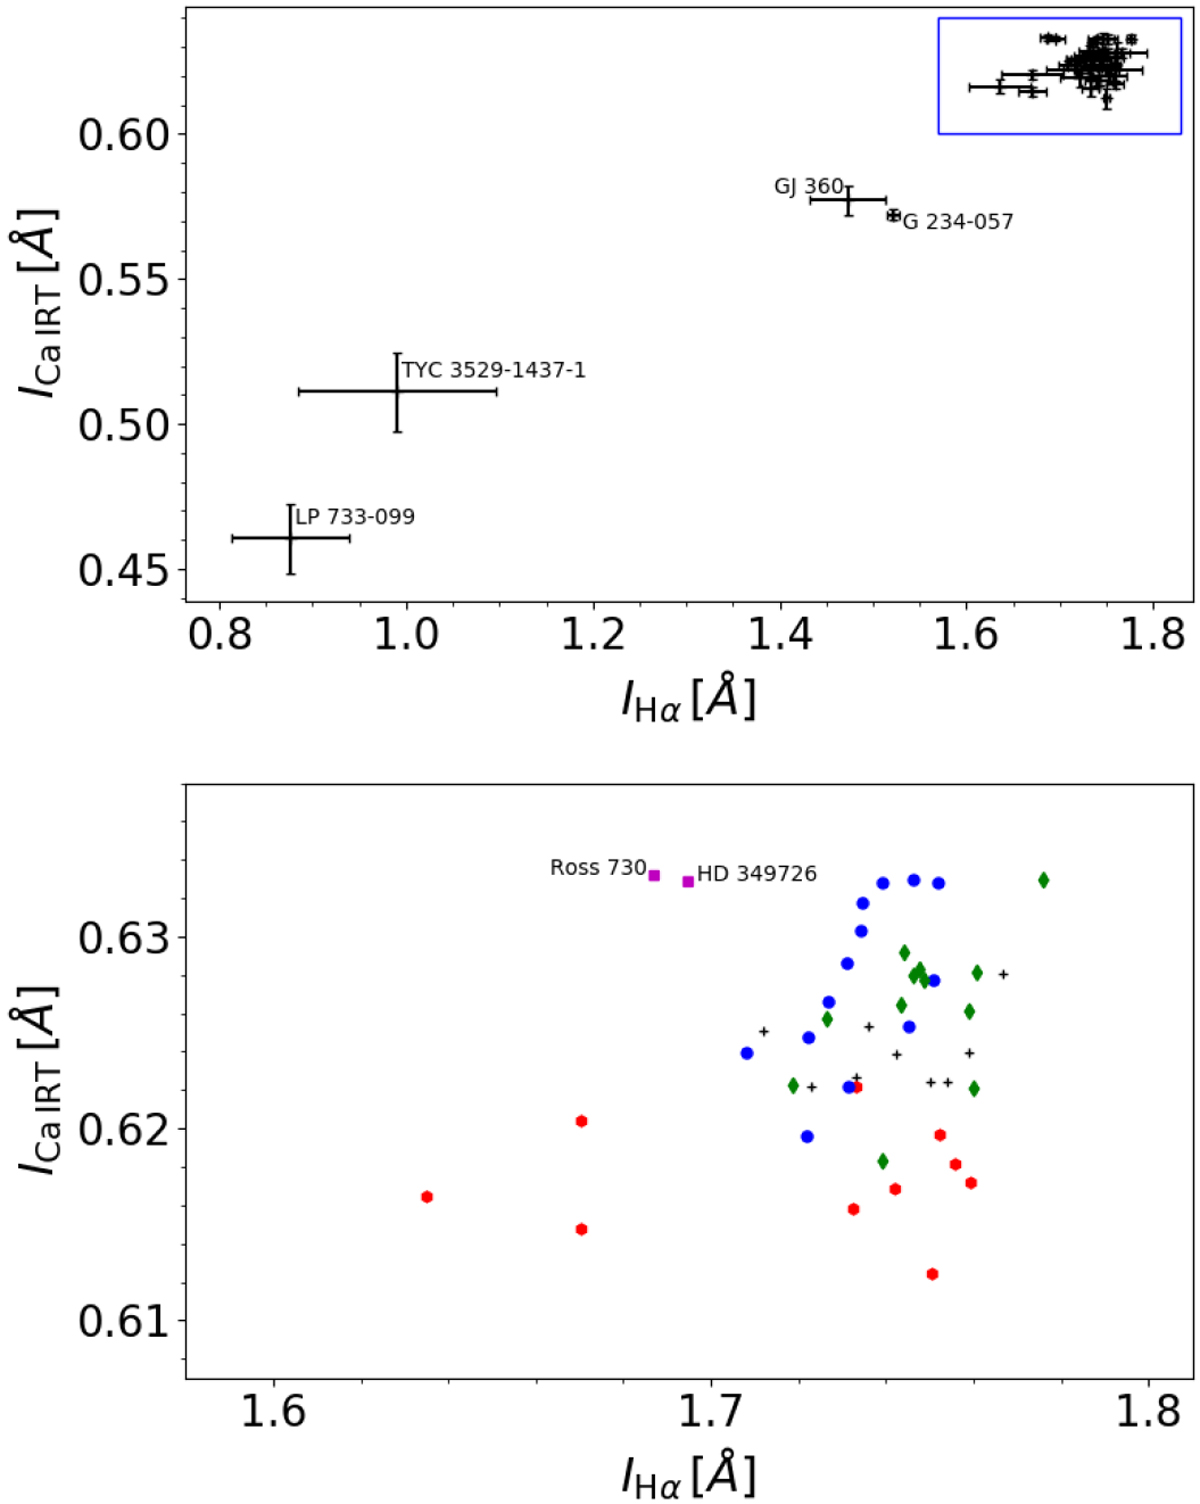
Upper panel: average Iline in the Ca II IRT line at 8500.35 Å against the average Iline in the Hα line of the investigated stars. The error bars correspond to the standard deviations of the line indices of individual spectra of the respective stars. Lower panel: zoom of the range of the inactive stars without error bars (blue box in the upper panel). The black pluses indicate the stars best fit by model #079, red hexagons indicate best fit by model #080, blue circles by #042, green diamonds by #047, and magenta squares by #029 (see Sect. 4.2). The model numbers and properties are given in Table C.1. To improve clarity, the errors are faded out in the lower panel.
Current usage metrics show cumulative count of Article Views (full-text article views including HTML views, PDF and ePub downloads, according to the available data) and Abstracts Views on Vision4Press platform.
Data correspond to usage on the plateform after 2015. The current usage metrics is available 48-96 hours after online publication and is updated daily on week days.
Initial download of the metrics may take a while.