Fig. 12
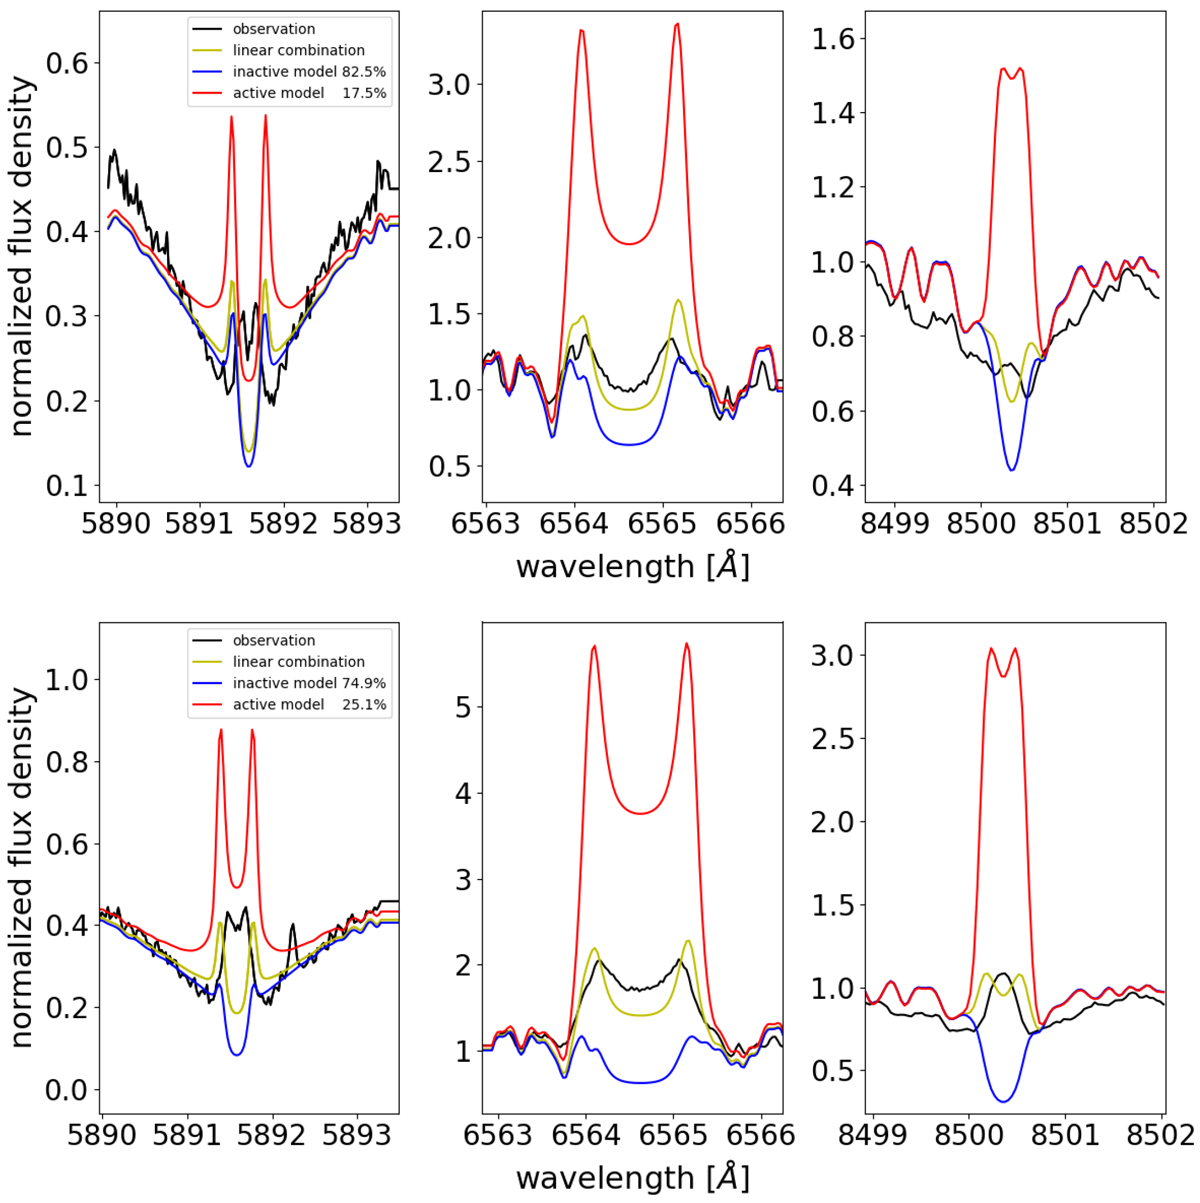
Comparison of the observed median activity spectrum to the best linear-combination fits for GJ 360 (upper panels, inactive model #080 and active model #132) and TYC 3529-1437-1 (lower panels, inactive model #079 and active model #149). The line of Na I D 2 and the bluest Ca II IRT line are weighted by a factor of 12, respectively, compared to Hα as describedin Sect. 4.1.
Current usage metrics show cumulative count of Article Views (full-text article views including HTML views, PDF and ePub downloads, according to the available data) and Abstracts Views on Vision4Press platform.
Data correspond to usage on the plateform after 2015. The current usage metrics is available 48-96 hours after online publication and is updated daily on week days.
Initial download of the metrics may take a while.