Fig. 1
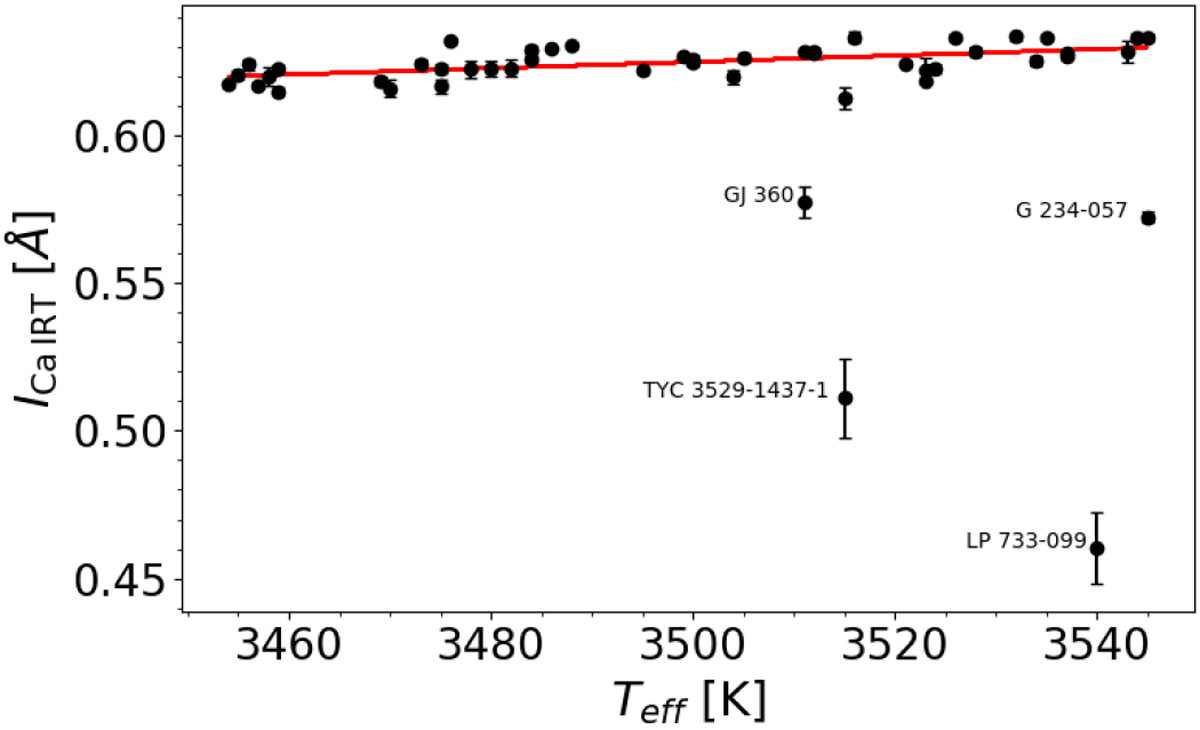
Average Iline in the Ca II IRT line at 8500.35 Å against the Teff of the investigated stars. The error bars correspond to the standard deviations of the line indices of individual spectra of the respective stars. The red line is a linear fit for the inactive stars exceeding ICa IRT = 0.6 Å. The four active stars are highlighted by their names.
Current usage metrics show cumulative count of Article Views (full-text article views including HTML views, PDF and ePub downloads, according to the available data) and Abstracts Views on Vision4Press platform.
Data correspond to usage on the plateform after 2015. The current usage metrics is available 48-96 hours after online publication and is updated daily on week days.
Initial download of the metrics may take a while.