Fig. 5.
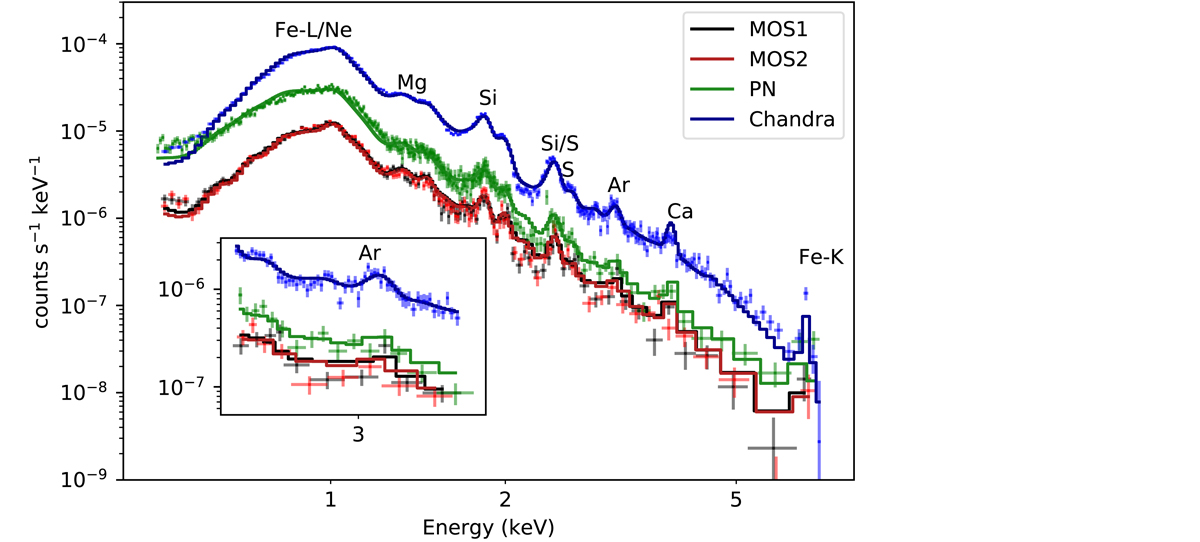
A comparison of the deprojected Chandra (blue) and the XMM-Newton MOS1 (black), MOS2 (red), and PN (green) spectra of the innermost shell; the most important emission lines have been marked. The Chandra spectrum has been scaled up by a factor of five for viewing purposes. The inset shows the zoomed-in spectra around the Ar line. It can be seen that a slight over/underestimation of the continuum in the broad-band fit can lead to an under/overestimation of the abundances, especially for the weak lines. It is also clearly seen that the XMM-Newton spectra around the high-energy lines (Ar, Ca and Fe-K) are very noisy and are not as resolved as in the Chandra spectrum and therefore the XMM-Newton spectra are not found suitable for the narrow-band analyses.
Current usage metrics show cumulative count of Article Views (full-text article views including HTML views, PDF and ePub downloads, according to the available data) and Abstracts Views on Vision4Press platform.
Data correspond to usage on the plateform after 2015. The current usage metrics is available 48-96 hours after online publication and is updated daily on week days.
Initial download of the metrics may take a while.