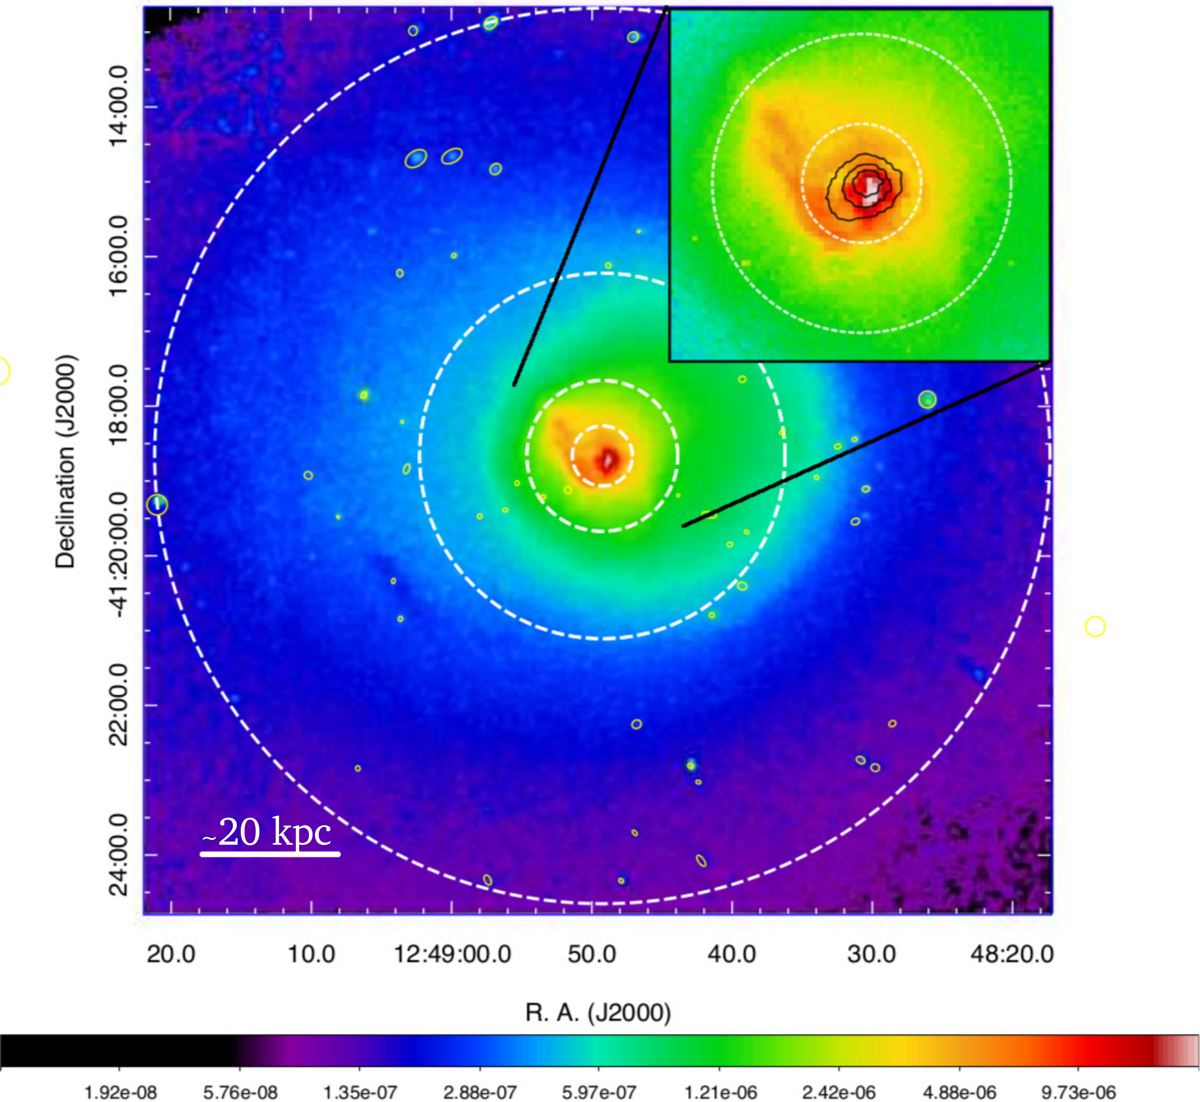
Fig. 1.

An exposure corrected 0.5–7.0 keV Chandra ACIS-S image of the Centaurus cluster. The color bar indicates the photon flux in counts cm−2 s−1. The white dashed circles show the four annular regions used for the spectral extraction. The inset is a zoomed-in section of the central region showing the central soft X-ray filaments and the asymmetric distribution of the central X-ray emission. The black contours in the inset are from a Herschel PACS 100 μm photometric observation of the cluster, and trace the central dust emission.
Current usage metrics show cumulative count of Article Views (full-text article views including HTML views, PDF and ePub downloads, according to the available data) and Abstracts Views on Vision4Press platform.
Data correspond to usage on the plateform after 2015. The current usage metrics is available 48-96 hours after online publication and is updated daily on week days.
Initial download of the metrics may take a while.


