Fig. 4.
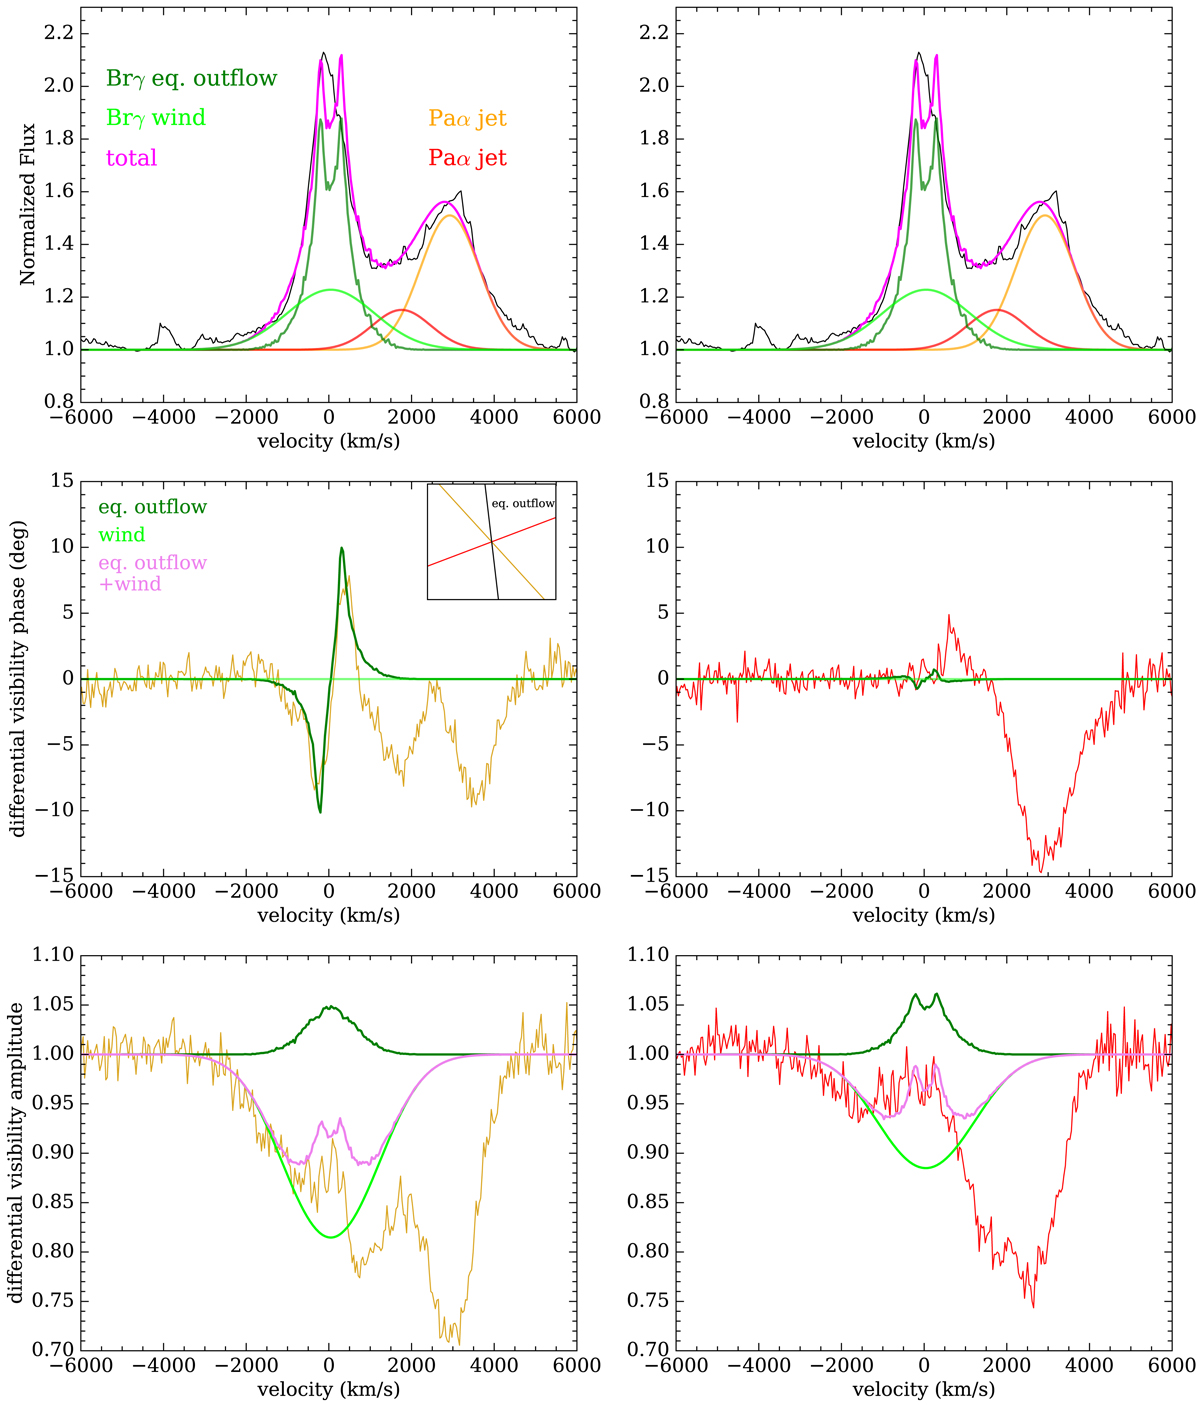
Main features of the data and model. We show two representative baselines (UT3-1, yellow, and UT4-3, red – see Fig. 1) for Epoch 2 and the outflow model fit. Top row: spectrum centered on the Brγ stationary line. The latter is decomposed into an equatorial outflow (dark green) and a spherical wind (lime). The former is responsible for the S-shape signatures in the differential visibility phases (middle row) for baselines which are close to perpendicular to the jet (left), and show almost no signature on baselines more aligned with the jet (right). The inset shows the position angle of the outflow from the fit as well as the baseline directions on the sky plane. Bottom row: differential visibility amplitudes. The equatorial outflow alone would lead to an increase in visibility amplitude across the Brγ line. The extended wind component can explain both the high-velocity (≳1000 km s−1) wings in the spectrum and the net decrease in visibility amplitude across the line. We note that there are two Paα emission lines from the receding jet that are blended with the Brγ stationary line on its red side, and also create strong visibility signatures. The model fits were done for all the components simultaneously, but here we show only the visibility model for the stationary line for clarity (full model is shown in the Appendix). For the jet model and results, we refer to the companion paper on the jets (Waisberg et al. 2018).
Current usage metrics show cumulative count of Article Views (full-text article views including HTML views, PDF and ePub downloads, according to the available data) and Abstracts Views on Vision4Press platform.
Data correspond to usage on the plateform after 2015. The current usage metrics is available 48-96 hours after online publication and is updated daily on week days.
Initial download of the metrics may take a while.