| Issue |
A&A
Volume 623, March 2019
|
|
|---|---|---|
| Article Number | A10 | |
| Number of page(s) | 4 | |
| Section | Planets and planetary systems | |
| DOI | https://doi.org/10.1051/0004-6361/201834643 | |
| Published online | 25 February 2019 | |
Prospects for detecting the astrometric signature of Barnard’s Star b
1
Department of Geophysics, Raymond and Beverly Sackler Faculty of Exact Sciences, Tel Aviv University,
Tel Aviv
6997801,
Israel
e-mail: This email address is being protected from spambots. You need JavaScript enabled to view it.
2
Institut de Ciències de l’Espai (ICE, CSIC),
Campus UAB, c/de Can Magrans s/n,
08193
Bellaterra,
Barcelona,
Spain
3
Institut d’Estudis Espacials de Catalunya (IEEC),
08034
Barcelona,
Spain
4
School of Physics and Astronomy, Queen Mary, University of London,
327 Mile End Road,
London,
E1 4NS,
UK
5
Institut für Astrophysik, Georg-August Universität,
Friedrich-Hund-Platz 1,
37077
Göttingen,
Germany
Received:
14
November
2018
Accepted:
9
January
2019
Abstract
A low-amplitude periodic signal in the radial velocity (RV) time series of Barnard’s Star was recently attributed to a planetary companion with a minimum mass of ~3.2 M⊕ at an orbital period of ~233 days. The relatively long orbital period and the proximity of Barnard’s Star to the Sun raises the question whether the true mass of the planet can be constrained by accurate astrometric measurements. By combining the assumption of an isotropic probability distribution of the orbital orientation with the RV-analysis results, we calculated the probability density function of the astrometric signature of the planet. In addition, we reviewed the astrometric capabilities and limitations of current and upcoming astrometric instruments. We conclude that Gaia and the Hubble Space Telescope (HST) are currently the best-suited instruments to perform the astrometric follow-up observations. Taking the optimistic estimate of their single-epoch accuracy to be ~30μas, we find a probability of ~10% to detect the astrometric signature of Barnard’s Star b with ~50 individual-epoch observations. In case of no detection, the implied mass upper limit would be ~8 M⊕, which would place the planet in the super-Earth mass range. In the next decade, observations with the Wide-Field Infrared Space Telescope (WFIRST) may increase the prospects of measuring the true mass of the planet to ~99%.
Key words: astrometry / stars: individual: Barnard’s Star / planetary systems
© ESO 2019
1. Introduction
Nearly 4000 exoplanets have been discovered in the last three decades1. Transiting-planet surveys, such as the NASA Kepler mission (Borucki et al. 2008), have provided ~75% of these discoveries, while the radial velocity (RV) technique has been used to discover another ~20% of them. These discoveries have enabled the estimation of the planet occurrence rates around FGKM dwarf stars (e.g., Howard et al. 2010, 2012; Dressing & Charbonneau 2013). It was found that ~50% of FGK dwarfs, and virtually all M dwarfs, harbor small planets (1–4 R⊕) in orbital periods ≲1 yr (e.g., Winn & Fabrycky 2015).
Focusing on the ~50 stellar systems within 5 pc from the Sun, we find that planets were discovered in ≲20 of these systems. If nearby stars follow the above occurrence rates, there are ~30 Earth-to-Neptune size planets in orbital periods ≲1 yr yet to be discovered. Assuming an isotropic distribution of orbit orientations, we do not expect to find more than one of these planets via transit search. The most promising way to find the yet-undetected planets would currently be the RV approach. The expected RV semi-amplitudes are on the order of 1 m s−1, which is at the detection limit of the currently available RV instruments such as HARPS (Mayor et al. 2003) and CARMENES (Quirrenbach et al. 2018). However, detecting the RV signals of these planets is complicated by the fact that most of the nearby stars are intrinsically faint M dwarfs and many are also magnetically active (e.g., Suárez Mascareño et al. 2017).
Planets found around nearby stars are valuable targets for follow-up studies. The proximity of these planetary systems to the Sun makes many of their planets accessible to direct imaging with next-decade telescopes, such as the Wide-Field Infrared Space Telescope (WFIRST; Spergel et al. 2015) and the European Extremely Large Telescope (ELT; Quanz et al. 2015). Another advantage of these systems being nearby is the larger orbital astrometric signature. While RV measurements allow us to estimate only the minimum mass of the planet (mp sin i), an astrometric orbit provides the inclination (i), and hence mp.
Barnard’s Star is the second-nearest stellar system. The search for planets around Barnard’s Star depicts the history of achievable astrometric and RV precision for M dwarfs. It is also one of the most famous premature claims for exoplanet detections. For two decades van de Kamp (1963, 1969a,b, 1975, 1982) claimed an astrometric detection of one or two Jovian planets with orbital periods between 11 and 26 yr. These claims were first questioned by Gatewood & Eichhorn (1973) and later rejected at a confidence level of ~ 94% by Choi et al. (2013). By using precision RVs, Choi et al. (2013) were able to exclude the possibility of Jupiter-mass planets at almost any orbital period ≲25 yr, except for the most unlikely case of almost face-on orbits. The best existing astrometric constraints on planets around Barnard’s Star were set by Benedict et al. (1999). Using the Fine Guidance Sensor of the Hubble Space Telescope (HST-FGS), Benedict et al. (1999) managed to exclude an astrometric orbital perturbation larger than 1250μas, with periods of 5–600 days, at ~ 95% confidence level, which translates to mass upper limits of ~ 1 MJ at P ~ 150 day orbit or ~ 0.5 MJ at P ~ 400 day orbit.
Recently, Ribas et al. (2018) have reported an RV detection of a planet candidate in orbit around Barnard’s Star. Table 1 gives the main parameters of Barnard’s Star and the detected planet. In this paper we ask the question whether the true mass of the planet can be constrained by accurate astrometric measurements of Barnard’s Star. In what follows, we estimate the probability of detecting the astrometric signature of the planet with existing and upcoming instruments, as well as the achievable mass upper limit in case of no detection.
Main parameters of Barnard’s Star and Barnard’s Star b.
2. Current and upcoming astrometric capabilities
When it comes to detecting planetary-induced astrometric orbits, with typical astrometric signatures of < 1000μas, the most important figure of merit is the single-epoch astrometric accuracy achievable by an instrument (σΛ). Ground-based differential astrometry is generally limited by atmospheric turbulence (Sahlmann et al. 2013). Although for subarcsecond binaries, a σΛ of ~ 10μas can be achieved with optical interferometry (e.g., Lane & Muterspaugh 2004), for single stars imaging astrometry can only achieve a σΛ of ~ 100μas with instruments such as the FORS2 camera on the Very Large Telescope (VLT-FORS2; Lazorenko et al. 2014; Sahlmann et al. 2014). For Barnard’s Star, however, performance might be degraded to σΛ ~300μas because of the scarcity of bright enough reference stars in the FORS2 field of view (e.g, Sahlmann et al. 2016). Next-decade 30 m class telescopes with wide-field correction adaptive optics might bring these numbers closer to the theoretical atmospheric limits of ~ 40μas (e.g., Trippe et al. 2010). However, astrometric characterization of bright stars, such as Barnard’s Star, would most efficiently be done from space.
HIPPARCOS astrometric measurements have one-dimensional σΛ of ~ 700μas for the brightest stars and typically ~ 1500μas for V = 9 mag stars, such as Barnard’s Star (Perryman et al. 1997; van Leeuwen 2007a,b). Astrometric measurements with the HST-FGS provided σΛ of 100–300μas for many targets over the last two decades (Benedict et al. 2017). A new approach that uses the HST Wide Field Camera 3 (HST-WFC3) in spacial-scanning mode demonstrated 20–80μas astrometric accuracy on bright stars (Riess et al. 2014, 2018; Casertano et al. 2016). Specifically for Barnard’s Star, however, the low number of bright enough reference stars in the WFC3 field of view means that achieving the highest possible accuracy with this method heavily depends on the ability to predict the variations of the geometric distortion of the detector produced by the thermal cycle of HST (Riess et al. 2014, 2018). An optimal filter choice and an improved optical model of the telescope may eventually lead to σΛ ~ 30μas.
Barnard’s Star is currently being observed by Gaia, among another ~ 1.3 billion stars of our Galaxy (Gaia Collaboration 2018b). By the end of 2018 it should have transited Gaia’s focal plane >50 times2, and by the end of 2022 the number of observations (Nobs) will grow to ≳100. However, about half of these scans are not individual-epoch observations, but rather adjacent transits of Gaia’s two fields of view, separated by a couple of hours. In addition, since Gaia performs global astrometry, the individual measurements of the highest possible accuracy will not be available before the final data release (Lindegren et al. 2016). The expected along-scan uncertainty for the G ≃ 8.2 mag Barnard’s Star varies from ~ 34μas (Perryman et al. 2014) through ~ 50μas (Sozzetti et al. 2014) to ≳ 100μas (Lindegren et al. 2018). The different estimates emerge from differences in the assumed levels of centroid, attitude, and calibration errors, and by the assumed impact of Gaia’s gating scheme on bright-star astrometry.
For the next decade NASA is planning to launch WFIRST. The WFIRST Astrometry Working Group et al. (2017) estimated that it will enable σΛ ~ 10μas astrometry, by using two different techniques: spatial scanning and diffraction spike modeling (see also Melchior et al. 2018). We consider this estimate as rather optimistic.
For the purpose of comparing the different astrometric instruments as follow-up tools to detect the planetary-induced orbit of Barnard’s Star, we assume for each instrument an optimistic–pessimistic range of the achievable single-epoch accuracy (σΛ). We take this range to be 100–300μas for the VLT, 30–100μas for Gaia and the HST, and 10–30μas for WFIRST. Additional issues that should be taken into account when comparing the different astrometric instruments are discussed in Sect. 4.
3. Astrometric signature of Barnard’s Star b
The astrometric motion of a planet-hosting star is composed of three major components: parallactic, proper, and orbital. The amplitude of the latter is usually referred to as the astrometric signature of the planet and is given by
 (1)
(1)
where aapp is the semimajor axis of the apparent orbit of the star, and ϖ is the parallax (e.g., Reffert & Quirrenbach 2011).
For RV-detected planets, a minimum barycentric semimajor axis of the host star, a⋆ sin i, and the planet’s minimum mass, mp sin i, can be derived from the orbital parameters via3
 (2)
(2)
 (3)
(3)
where G is the universal gravitational constant, and the other parameters are defined in Table 1 (e.g., Eggenberger & Udry 2010). The approximation in Eq. (3) is valid for mp ≪ m⋆.
For a star at a known distance, assuming an isotropic distribution of orbital orientations, which induces a known probability distribution of the inclination, we can estimate the probability of the astrometric signature to be in a certain range of values. In particular, we can estimate the probability of the astrometric signature to be above the detection thresholds of the various available instruments. Moreover, owing to the close relation between sin i and the expected astrometric signature of a known RV planet, a nondetection at a given threshold can be translated to an inclination lower limit, which can be directly translated to an upper limit on the mass of the planet if the mass of the star is known.
By combining numerous measurements from precision RV instruments, Ribas et al. (2018) have revealed a low-amplitude periodic signal in the RVs of Barnard’s Star, which is best explained by a planetary companion with a minimum mass of ~ 3.2 M⊕ at an orbitalperiod of ~233 days. The orbital-parameter uncertainties, listed in Table 1, were estimated by using Markov chain Monte Carlo (MCMC) analysis. In order to estimate the detectability of Barnard’s Star astrometric signature, we used theRV-analysis MCMC chain of Ribas et al. (2018). For each point in the chain we calculated a⋆ sin i using Eq. (2). In addition, for each MCMC point we drew an inclination from an isotropic orbital-orientation distribution, i.e., from a sin i probability density function (PDF). By doing so, we actually assumed a flat prior for the mass of Barnard’s Star b (e.g., Ho & Turner 2011; Lopez & Jenkins 2012). Given the as yet unknown mass distribution of planets in orbital periods of > 200 days around M dwarfs (e.g., Dressing & Charbonneau 2015), we believe this is a reasonable assumption.
For each MCMC+inclination chain point, we translated the orbital parameters to the semimajor axis of the apparent orbit (aapp) by using the prescription given in Appendix A of Reffert & Quirrenbach (2011). The calculation uses a⋆, ω, i, e, and Ω, the latter being the longitude of the ascending node. Since Ω cannot be estimated from the RVs, but the resulting aapp is independent of its value, we arbitrarily chose Ω = π. We then translated aapp to α by using Eq. (1). We thus converted the RV-analysis results to a PDF of α.
In order to illustrate the process, Fig. 1 shows the resulting chain of α values as a function of the simulated sin i chain. We then used the α PDF to estimate the probability of detecting the astrometric signature of the planet (Pdet) as the fraction of chain points with α above a certain detection threshold (Tdet). The horizontal lines in Fig. 1 represent the selected detection thresholds, which can be associated with either the optimistic or the pessimistic σΛ of four of the different astrometric instruments discussed in Sect. 2. In Table 2 we give the estimated Pdet for the four possible Tdet values, and their association with the different astrometric instruments.
For thecase of no detection, we estimated the mass upper limit (mup) in a similar fashion. For each MCMC+inclination chain point, we derived the corresponding planet mass using Eq. (3), thus creating a PDF of mp. Each Tdet separates the mp PDF in two, slightly overlapping, PDFs: one for detectable orbits and one for nondetectable orbits. We then estimated mup as the highest possible mass for the nondetectable orbits. The values of mup for the different values of Tdet are also given in Table 2.
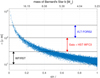 |
Fig. 1. Astrometric signature of Barnard’s Star b, calculated from the RV-analysis MCMC chain of Ribas et al. (2018), as a function of the simulated sin i chain. The horizontal lines indicate the detection thresholds discussed in the main text. The pessimistic–optimistic single-epoch accuracy range of the four instruments discussed in the main text are specified with the colored arrows. The plot is truncated at 1250μas following the upper limit set by Benedict et al. (1999). As a reference, the planet mass corresponding to each sin i value (assuming mp sin i = 3.23 M⊕) is indicated at the top of the panel. |
Detection probabilities for the astrometric signature of Barnard’s Star b, and mass upper limits in case of no detection, for four different detection thresholds, and their association with either the optimistic or the pessimistic single-epoch accuracy of the four astrometric instruments discussed in the main text.
4. Discussion
The two existing most promising instruments to detect the astrometric signature of Barnard’s Star b are Gaia and the HST. However, both have intrinsic systematic issues that might prevent them from achieving their best performance for this task. Moreover, Barnard’s Star has specific properties that complicate the astrometric confirmation. We now address the issues that would have the largest impact on the astrometric-signature detectability and discuss possible mitigation strategies.
In Sect. 3 we assigned Tdet = σΛ. This assignment assumes that an astrometric orbit can be detected for α ≳σΛ. Considering the case of unknown orbital periods, Casertano et al. (2008) required α ≳ 3σΛ to detect a planetary orbit. For RV-detected planets, however, Sahlmann et al. (2011) showed that the astrometric signature can be detected with HIPPARCOS data if α ≳ σΛ. More specifically, they showed that the correct orbital parameters are derived when the orbit is detected at a significance of > 3σ, which can be achieved for an astrometric signal-to-noise ratio of ![Mathematical equation: $S/N \,{=}\, \alpha\cdot\sqrt[]{N_{\textrm{obs}}}/\sigma_{\Lambda} \,{>}\, 7$](/articles/aa/full_html/2019/03/aa34643-18/aa34643-18-eq4.png) (see also Sahlmann et al. 2016). Assuming a similar relation for both Gaia and HST, we conclude that an α = σΛ planetary-induced orbits of known RV planets will be detected with Nobs ≳ 50. For Gaia, Nobs is defined by the mission duration and scanning law. The mission extension to end of 2022 will indeed bring the number of individual-epoch observations of Barnard’s Star to ≳ 50. In HST there is the advantage that Nobs can be tuned to achieve a desired detectability once the actual σΛ has been determined from preliminary observations (e.g., Riess et al. 2014).
(see also Sahlmann et al. 2016). Assuming a similar relation for both Gaia and HST, we conclude that an α = σΛ planetary-induced orbits of known RV planets will be detected with Nobs ≳ 50. For Gaia, Nobs is defined by the mission duration and scanning law. The mission extension to end of 2022 will indeed bring the number of individual-epoch observations of Barnard’s Star to ≳ 50. In HST there is the advantage that Nobs can be tuned to achieve a desired detectability once the actual σΛ has been determined from preliminary observations (e.g., Riess et al. 2014).
Another important aspect of Nobs and of observations scheduling is the need to simultaneously constrain several parameters, some of which are correlated among each other. For a single planet around Barnard’s Star, the astrometric model is a nonlinear function of 14 parameters: the seven standard astrometric parameters (including secular acceleration4), and another seven orbital parameters for the planet (e.g., Sahlmann et al. 2011). Five of the seven orbital parameters are common to astrometry and RV, so we are left with nine parameters to be determined only by the astrometric measurements:  and i. The annual change in parallax (
 μas yr−1; Dravins et al. 1999) and the secular acceleration due to change in perspective (
 mas yr−2; Benedict et al. 1999) are not independent parameters, but rather functions of ϖ, μ, and the absolute RV. Therefore, Nobs ~ 50 should give enough degrees of freedom to constrain all nine parameters.
Barnard’s Star’s high proper motion may degrade the achievable precision in narrow-field relative astrometry. Over time, it might lead to changing the set of reference stars. This is a major problem for VLT and HST astrometry, but not for Gaia. In addition, Barnard’s Star’s ~1% photometric variability (Benedict et al. 1998) might induce astrometric jitter. However, it is not expected to be larger than a few μas (e.g., Eriksson & Lindegren 2007).
Ribas et al. (2018) have also mentioned that a particular way of combining the measured RVs leads to the detection of an additional modulation with a period >10 yr. Although this long-term perturbation most likely arises from a magnetic activity cycle, its interpretation as an additional planet with mp sin i ~ 15 M⊕ is not ruled out. The minimum astrometric signature of such a massive outer planet would be ~ 500μas, which can be detected by any of the instruments mentioned in Table 2.
5. Summary and conclusions
We reviewed the astrometric capabilities and limitations of current and forthcoming instruments, and found Gaia and the HST to be currently the most promising instruments to detect the astrometric signature of Barnard’s Star b. Taking the optimistic estimate of their single-epoch accuracy of ~30μas, we found a probability of ~10% to detect the planet’s astrometric signature with Nobs ~ 50. In case of no detection, which would correspond to a nearly edge-on orbit, the implied mass upper limit would be mp ≲ 8 M⊕, which would place the planet in the super-Earth mass range.
Despite the fact that Gaia will continue observing Barnard’s Star for the next few years and will release its results around 2023, we expect additional astrometric HST-WFC3 follow-up observations to improve the constraints on the mass of Barnard’s Star b. The timings and scan directions of HST observations can be tuned to help determiningthe free parameters of the full astrometric model. If in the next decade an accuracy of σΛ ~ 10μas is indeed reached for Barnard’s Star, for example with WFIRST (Melchior et al. 2018), the prospects of measuring the true mass of the planet will grow to ~99%. Then, Gaia and HST observations performed in the next few years will set valuable constraints on some parameters of the astrometric model that benefit from observations over a long time baseline.
In the coming few years, RV surveys of nearby stars, such as CARMENES (Quirrenbach et al. 2018) and Reddots5, are expected to detect dozens of Earth-to-Neptune mass planets with orbital periods ≲1 yr. These planets will be excellent targets for characterization with existing and upcoming complementary techniques, such as direct imaging and astrometry.
Acknowledgements
This research was supported by the Israel Science Foundation (grant No. 848/16), with additional contributions by the DFG Research Unit FOR2544 “Blue Planets around Red Stars”. G.A.-E. research is funded via the STFC Consolidated Grant ST/P000592/1, and a Perren foundation grant.
References
- Benedict, G. F., McArthur, B., Nelan, E., et al. 1998, AJ, 116, 429 [NASA ADS] [CrossRef] [Google Scholar]
- Benedict, G. F., McArthur, B., Chappell, D. W., et al. 1999, AJ, 118, 1086 [NASA ADS] [CrossRef] [Google Scholar]
- Benedict, G. F., McArthur, B. E., Nelan, E. P., & Harrison, T. E. 2017, PASP, 129, 012001 [NASA ADS] [CrossRef] [Google Scholar]
- Borucki, W., Koch, D., Basri, G., et al. 2008, IAU Symp., 249, 17 [NASA ADS] [Google Scholar]
- Casertano, S., Lattanzi, M. G., Sozzetti, A., et al. 2008, A&A, 482, 699 [NASA ADS] [CrossRef] [EDP Sciences] [Google Scholar]
- Casertano, S., Riess, A. G., Anderson, J., et al. 2016, ApJ, 825, 11 [NASA ADS] [CrossRef] [Google Scholar]
- Choi, J., McCarthy, C., Marcy, G. W., et al. 2013, ApJ, 764, 131 [NASA ADS] [CrossRef] [Google Scholar]
- Dravins, D., Lindegren, L., & Madsen, S. 1999, A&A, 348, 1040 [NASA ADS] [Google Scholar]
- Dressing, C. D., & Charbonneau, D. 2013, ApJ, 767, 95 [NASA ADS] [CrossRef] [Google Scholar]
- Dressing, C. D., & Charbonneau, D. 2015, ApJ, 807, 45 [NASA ADS] [CrossRef] [Google Scholar]
- Eggenberger, A., & Udry, S. 2010, EAS Pub. Ser., 41, 27 [CrossRef] [Google Scholar]
- Eriksson, U., & Lindegren, L. 2007, A&A, 476, 1389 [NASA ADS] [CrossRef] [EDP Sciences] [Google Scholar]
- Gaia Collaboration 2018a, VizieR Online Data Catalog: I/345 [Google Scholar]
- Gaia Collaboration (Brown, A. G. A., et al.) 2018b, A&A, 616, A1 [NASA ADS] [CrossRef] [EDP Sciences] [Google Scholar]
- Gatewood, G.,& Eichhorn, H. 1973, AJ, 78, 769 [NASA ADS] [CrossRef] [Google Scholar]
- Ho, S., & Turner, E. L. 2011, ApJ, 739, 26 [NASA ADS] [CrossRef] [Google Scholar]
- Howard, A. W., Marcy, G. W., Johnson, J. A., et al. 2010, Science, 330, 653 [NASA ADS] [CrossRef] [PubMed] [Google Scholar]
- Howard, A. W., Marcy, G. W., Bryson, S. T., et al. 2012, ApJS, 201, 15 [NASA ADS] [CrossRef] [Google Scholar]
- Lane, B. F., & Muterspaugh, M. W. 2004, ApJ, 601, 1129 [NASA ADS] [CrossRef] [Google Scholar]
- Lazorenko, P. F., Sahlmann, J., Ségransan, D., et al. 2014, A&A, 565, A21 [NASA ADS] [CrossRef] [EDP Sciences] [Google Scholar]
- Lindegren, L., Lammers, U., Bastian, U., et al. 2016, A&A, 595, A4 [NASA ADS] [CrossRef] [EDP Sciences] [Google Scholar]
- Lindegren, L., Hernández, J., Bombrun, A., et al. 2018, A&A, 616, A2 [NASA ADS] [CrossRef] [EDP Sciences] [Google Scholar]
- Lopez, S., & Jenkins, J. S. 2012, ApJ, 756, 177 [NASA ADS] [CrossRef] [Google Scholar]
- Mayor, M., Pepe, F., Queloz, D., et al. 2003, The Messenger, 114, 20 [NASA ADS] [Google Scholar]
- Melchior, P., Spergel, D., & Lanz, A. 2018, AJ, 155, 102 [NASA ADS] [CrossRef] [Google Scholar]
- Nidever, D. L., Marcy, G. W., Butler, R. P., Fischer, D. A., & Vogt, S. S. 2002, ApJS, 141, 503 [NASA ADS] [CrossRef] [Google Scholar]
- Perryman, M. A. C., Lindegren, L., Kovalevsky, J., et al. 1997, A&A, 323, L49 [NASA ADS] [Google Scholar]
- Perryman, M., Hartman, J., Bakos, G. Á., & Lindegren, L. 2014, ApJ, 797, 14 [NASA ADS] [CrossRef] [Google Scholar]
- Quanz, S. P., Crossfield, I., Meyer, M. R., Schmalzl, E., & Held, J. 2015, Int. J. Astrobiol., 14, 279 [CrossRef] [Google Scholar]
- Quirrenbach, A., Amado, P. J., Ribas, I., et al. 2018, SPIE Conf. Ser., 10702, 107020W [Google Scholar]
- Reffert, S., & Quirrenbach, A. 2011, A&A, 527, A140 [NASA ADS] [CrossRef] [EDP Sciences] [Google Scholar]
- Reiners, A., Zechmeister, M., Caballero, J. A., et al. 2018, A&A, 612, A49 [NASA ADS] [CrossRef] [EDP Sciences] [Google Scholar]
- Ribas, I., Tuomi, M., Reiners, A., et al. 2018, Nature, 563, 365 [NASA ADS] [CrossRef] [Google Scholar]
- Riess, A. G., Casertano, S., Anderson, J., MacKenty, J., & Filippenko, A. V. 2014, ApJ, 785, 161 [NASA ADS] [CrossRef] [Google Scholar]
- Riess, A. G., Casertano, S., Yuan, W., et al. 2018, ApJ, 855, 136 [NASA ADS] [CrossRef] [Google Scholar]
- Sahlmann, J., Ségransan, D., Queloz, D., et al. 2011, A&A, 525, A95 [NASA ADS] [CrossRef] [EDP Sciences] [Google Scholar]
- Sahlmann, J., Lazorenko, P. F., Mérand, A., et al. 2013, in Techniques and Instrumentation for Detection of Exoplanets VI, Proc. SPIE, 8864, 88641B [CrossRef] [Google Scholar]
- Sahlmann, J., Lazorenko, P. F., Ségransan, D., et al. 2014, A&A, 565, A20 [NASA ADS] [CrossRef] [EDP Sciences] [Google Scholar]
- Sahlmann, J., Lazorenko, P. F., Ségransan, D., et al. 2016, A&A, 595, A77 [NASA ADS] [CrossRef] [EDP Sciences] [Google Scholar]
- Sozzetti, A., Giacobbe, P., Lattanzi, M. G., et al. 2014, MNRAS, 437, 497 [NASA ADS] [CrossRef] [Google Scholar]
- Spergel, D., Gehrels, N., Baltay, C., et al. 2015, ArXiv e-prints [arXiv:1503.03757] [Google Scholar]
- Suárez Mascareño, A., González Hernández, J. I., Rebolo, R., et al. 2017, A&A, 597, A108 [NASA ADS] [CrossRef] [EDP Sciences] [Google Scholar]
- The WFIRST Astrometry Working Group (Sanderson, R. E., et al.) 2017, PASP, submitted [arXiv:1712.05420] [Google Scholar]
- Trippe, S., Davies, R., Eisenhauer, F., et al. 2010, MNRAS, 402, 1126 [NASA ADS] [CrossRef] [Google Scholar]
- van de Kamp, P. 1963, AJ, 68, 515 [NASA ADS] [CrossRef] [Google Scholar]
- van de Kamp, P. 1969a, AJ, 74, 757 [NASA ADS] [CrossRef] [Google Scholar]
- van de Kamp, P. 1969b, AJ, 74, 238 [NASA ADS] [CrossRef] [Google Scholar]
- van de Kamp, P. 1975, AJ, 80, 658 [NASA ADS] [CrossRef] [Google Scholar]
- van de Kamp, P. 1982, Vistas Astron., 26, 141 [NASA ADS] [CrossRef] [Google Scholar]
- van Leeuwen, F. 2007a, HIPPARCOS, the New Reduction of the Raw Data, 350 (New York: Springer) [Google Scholar]
- van Leeuwen, F. 2007b, A&A, 474, 653 [NASA ADS] [CrossRef] [EDP Sciences] [Google Scholar]
- Winn, J. N., & Fabrycky, D. C. 2015, ARA&A, 53, 409 [NASA ADS] [CrossRef] [Google Scholar]
The term “minimum” refers to the unknown inclination.
We assume the change in secular acceleration will be negligible in the timespan of HST and Gaia observations.
All Tables
Detection probabilities for the astrometric signature of Barnard’s Star b, and mass upper limits in case of no detection, for four different detection thresholds, and their association with either the optimistic or the pessimistic single-epoch accuracy of the four astrometric instruments discussed in the main text.
All Figures
|
Fig. 1. Astrometric signature of Barnard’s Star b, calculated from the RV-analysis MCMC chain of Ribas et al. (2018), as a function of the simulated sin i chain. The horizontal lines indicate the detection thresholds discussed in the main text. The pessimistic–optimistic single-epoch accuracy range of the four instruments discussed in the main text are specified with the colored arrows. The plot is truncated at 1250μas following the upper limit set by Benedict et al. (1999). As a reference, the planet mass corresponding to each sin i value (assuming mp sin i = 3.23 M⊕) is indicated at the top of the panel. |
| In the text | |
Current usage metrics show cumulative count of Article Views (full-text article views including HTML views, PDF and ePub downloads, according to the available data) and Abstracts Views on Vision4Press platform.
Data correspond to usage on the plateform after 2015. The current usage metrics is available 48-96 hours after online publication and is updated daily on week days.
Initial download of the metrics may take a while.