Fig. 1.
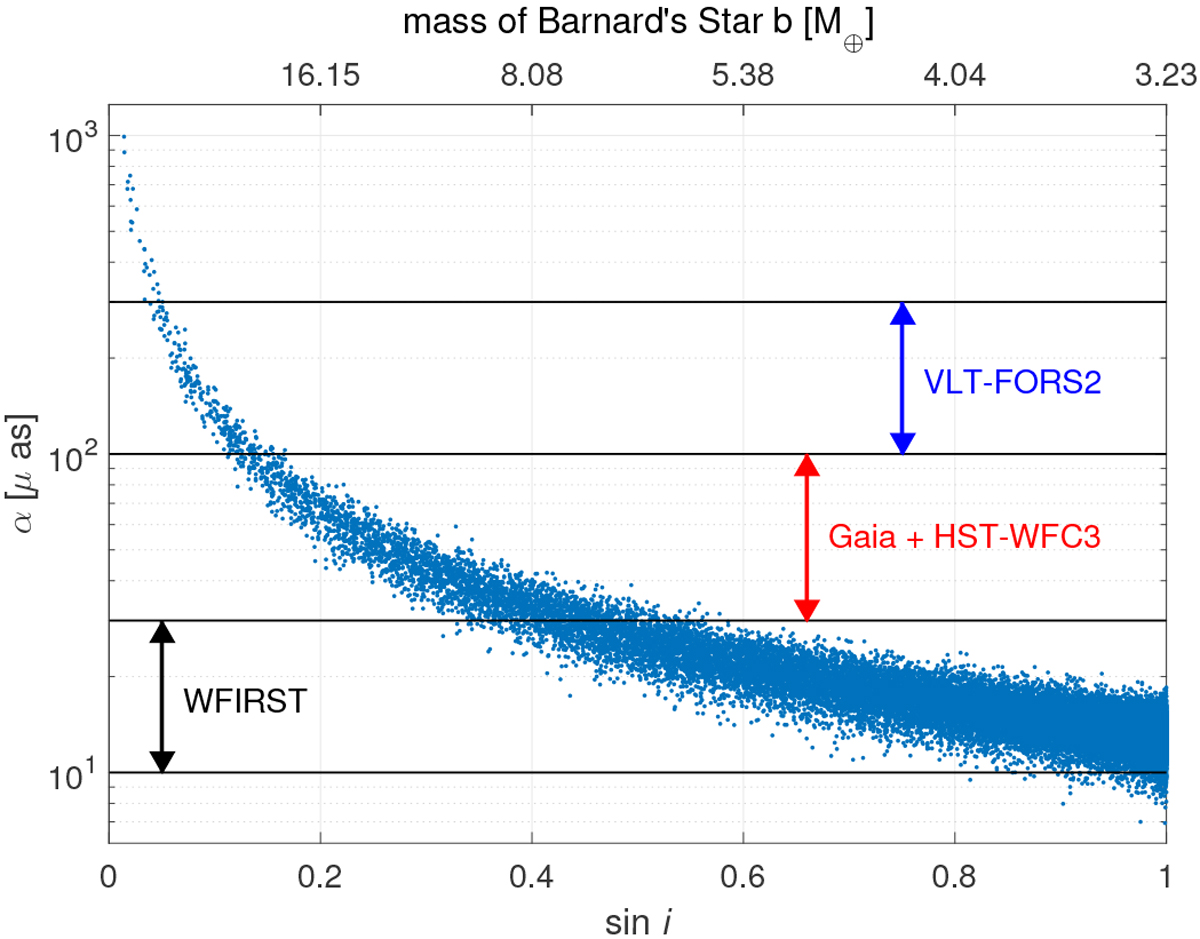
Astrometric signature of Barnard’s Star b, calculated from the RV-analysis MCMC chain of Ribas et al. (2018), as a function of the simulated sin i chain. The horizontal lines indicate the detection thresholds discussed in the main text. The pessimistic–optimistic single-epoch accuracy range of the four instruments discussed in the main text are specified with the colored arrows. The plot is truncated at 1250μas following the upper limit set by Benedict et al. (1999). As a reference, the planet mass corresponding to each sin i value (assuming mp sin i = 3.23 M⊕) is indicated at the top of the panel.
Current usage metrics show cumulative count of Article Views (full-text article views including HTML views, PDF and ePub downloads, according to the available data) and Abstracts Views on Vision4Press platform.
Data correspond to usage on the plateform after 2015. The current usage metrics is available 48-96 hours after online publication and is updated daily on week days.
Initial download of the metrics may take a while.