| Issue |
A&A
Volume 623, March 2019
|
|
|---|---|---|
| Article Number | A46 | |
| Number of page(s) | 7 | |
| Section | Stellar structure and evolution | |
| DOI | https://doi.org/10.1051/0004-6361/201834638 | |
| Published online | 04 March 2019 | |
Discovery of kilogauss magnetic fields on the nearby white dwarfs WD 1105–340 and WD 2150+591⋆
1
Armagh Observatory and Planetarium, College Hill, Armagh BT61 9DG, UK
e-mail: This email address is being protected from spambots. You need JavaScript enabled to view it.
, This email address is being protected from spambots. You need JavaScript enabled to view it.
2
University of Western Ontario, Department of Physics & Astronomy, London, Ontario N6G 1P7, Canada
e-mail: This email address is being protected from spambots. You need JavaScript enabled to view it.
Received:
13
November
2018
Accepted:
24
January
2019
Abstract
Magnetic fields are present in roughly 10% of white dwarfs. These fields affect the structure and evolution of such stars, and may provide clues about their earlier evolution history. Particularly important for statistical studies is the collection of high-precision spectropolarimetric observations of (1) complete magnitude-limited samples and (2) complete volume-limited samples of white dwarfs. In the course of one of our surveys we have discovered previously unknown kG-level magnetic fields on two nearby white dwarfs, WD 1105–340 and WD 2150+591. Both stars are brighter than mV = 15. WD 2150+591 is within the 20 pc volume around the Sun, while WD 1105–340 is just beyond 25 pc in distance. These discoveries increase the small sample of such weak-field white dwarfs from 21 to 23 stars. Our data appear consistent with roughly dipolar field topology, but it also appears that the surface field structure may be more complex on the older star than on the younger one, a result similar to one found earlier in our study of the weak-field stars WD 2034+372 and WD 2359–434. This encourages further efforts to uncover a clear link between magnetic morphology and stellar evolution.
Key words: stars: magnetic field / white dwarfs / polarization / stars: individual: WD 1105–340 / stars: individual: WD 2150+591
Based on observations obtained at the Canada-France-Hawaii Telescope (CFHT) which is operated by the National Research Council of Canada, the Institut National des Sciences de l’Univers of the Centre National de la Recherche Scientifique of France, and the University of Hawaii, under Programme 18AC006; on observations made with ESO Telescopes at the La Silla Paranal Observatory, under programme IDs 0101.D-0103 and 0102.D-0045(A),; and at the Observatorios de Canarias del IAC with the William Herschel Telescope, operated on the island of La Palma by the Isaac Newton Group of Telescopes in the Observatorio del Roque de los Muchachos, under Programme 18B-P15.
© ESO 2019
1. Introduction
Magnetic fields play important roles in stars. They transfer angular momentum, both internally during stellar evolution, and externally during periods of accretion or mass loss. Even a fairly weak magnetic field can suppress convection in stellar atmospheres and affect cooling times of extremely old white dwarfs (Tremblay et al. 2015). From the properties of upper main sequence magnetic stars, it is clear that a field can strongly alter the surface chemistry of a star. In cool stars with dynamo fields, magnetism can lead to quite spectacular surface activity, as is seen in the Sun.
Magnetic fields were first discovered on white dwarfs (WDs) almost 50 years ago (e.g. Kemp et al. 1970; Angel & Landstreet 1971; Landstreet & Angel 1971). They have been studied fairly extensively since that time (Angel 1978; Landstreet 1992; Ferrario et al. 2015). For about 30 years, new magnetic white dwarfs (MWDs) were discovered at a rate of about 1–2 per year, at first from detection of broad-band circular polarisation, and later also from observation of spectral lines strongly shifted and distorted by the Zeeman effect and its extension to high magnetic field strengths.
More recently, many hundreds of new MWDs have been discovered thanks to the Sloan Digital Sky Survey (SDSS; e.g. Schmidt et al. 2003; Kepler et al. 2016), but because of the low resolving power and modest S/N of these SDSS spectra, the new discoveries are almost entirely found in the field strength range between about 1–2 and 80 MG. At the same time, interest in possible weaker fields has led to a small number of discoveries of fields below 1 MG, down to a few kG (e.g. Schmidt & Smith 1994; Aznar Cuadrado et al. 2004; Koester et al. 2009; Kawka & Vennes 2014). It is now clear that the range of field strengths in MWDs covers at least five dex, from a few kG to nearly 1000 MG.
Some of the fields are observed to vary. When the variations are studied, they appear to be periodic, and apparently arise only from the rotation of the underlying star, with periods usually of the order of hours or days. Both single spectra and series of spectropolarimeteric observations have been modelled in a few cases, and it appears that the field structure is organised at a large scale, sometimes with a configuration simple enough to be described as a dipole tilted at an angle with respect to the rotation axis. MWD fields appear to be examples of “fossil fields”, retained in the stars from prior evolution stages, which are no longer being actively generated by stellar dynamo action.
Evolution of magnetic fields leading to MWDs is not understood. Even evolution during the WD stage is still unclear. Samples of MWDs that might illuminate evolution during the WD phase are frequently magnitude-limited samples in which one can study the overall frequency of MWDs, and (in principle) the evolution of frequencies. Such samples are heavily biased by V magnitude, and require uncertain corrections for incompleteness. To study evolution during the WD stage, it is better to use volume-limited samples. In such samples, older stars can be seen as descendants of younger stars, so we can almost directly study magnetic field evolution: do the older stars in the sample show a similar fraction of MWDs as the younger stars? Are the fields found on old MWDs weaker than on young MWDs, or stronger? Do the field structures evolve with age in a systematic way?
We are trying to answer some of these questions by achieving a largely complete magnetic survey of both a reasonable magnitude-limited sample down to somewhere between mV = 14 and 15, and of the 20 pc volume. The 20 pc sample in particular requires including as many of the coolest nearby WDs as possible. Many of the cooler (and fainter) WDs within 20 pc of the Sun have never been searched for magnetic fields weaker than 1–2 MG, the limit reached with normal low-dispersion classification spectroscopy of DA and DB stars. Some nearby WDs (particularly featureless DCs and DQs with only molecular band absorption) still have almost no useful limit on possible magnetic fields. We also aim to study the magnetic field structure of a usefully large sample of WDs with fields in the kG range.
In the course of our surveys we have discovered two bright new weak-field magnetic white dwarfs. The field of one was not detected with classification spectroscopy, and the other is a newly recognised white dwarf. These two stars are discussed in this paper.
2. Observations
Weak fields can be detected in primarily two ways, both using the changes to spectral lines resulting from the Zeeman effect, which splits and polarises spectral lines when a magnetic field is present on the surface of the star (e.g. Donati & Landstreet 2009; Bagnulo & Landstreet 2015). The effect on the normal flux or intensity spectrum (Stokes I) is that single spectra lines, such as those of the Balmer series of H, split into multiple lines. In the case of the Balmer lines, each single line core splits into three components, one of which (for fields below about 1 MG) remains at nearly the zero-field position, while two flanking components appear, one at shorter and one at longer wavelengths, separated from the central component by a wavelength difference that grows with the strength of the magnetic field. For Hα the two flanking (σ) components are shifted from the central (π) component by about 1 Å per 50 kG of field strength. More generally, the splitting depends on wavelength and field strength as
 (1)
(1)
where ΔλZ is the separation between the π and one σ component, λ0 is the wavelength of the spectral line in the absence of a magnetic field, ⟨|B|⟩ is the magnetic field strength averaged over the visible stellar hemisphere, and the effective Landé factor g is a constant for each line, equal to 1.0 for Balmer lines.
The detectability of such splitting depends on both the resolution and the S/N ratio of the WD spectrum. The low resolution (R ∼ 800) usually used to classify and characterise WDs can only resolve magnetic splitting for fields of 1–2 MG in the blue, or for fields of a few hundred kG at Hα. Further, with a S/N of less than about 20 the Zeeman splitting, if present, may be mistaken for noise in the line core. With higher resolution (R > 8000, say) the splitting can be recognised at Hα for fields of about 100 kG, and with a resolving power of 50 000 or more the splitting can be observed in Hα down to the limit set by the intrinsic width of the central non-LTE line core of about 1 Å, so that Zeeman splitting can be resolved down to about 50 kG and line core broadening can be detected down to about 20 kG.
In addition to splitting a single spectral line into multiple (often three) components, the Zeeman effect also leads to polarisation of the various components. In particular, the σ components are circularly polarised in opposite senses when the field has a substantial component along the line of sight, both in emission and in absorption. The mean wavelengths λr and λl of a spectral line as viewed in right and left circularly polarised light are different, and the separation Δλlos between these two mean wavelengths of a line is proportional to the line-of-sight component of the magnetic field averaged over the visible stellar hemisphere, ⟨Bz⟩:
 (2)
(2)
where all wavelengths are measured in Å.
The separation Δλlos can be measured in two somewhat different ways. (1) in the case where the field is sufficiently weak (or even not present) that the shape of the observed Stokes I line profile is not perturbed significantly (at the observational resolving power) from the non-magnetic shape, so that both circularly polarised line profiles Ir and Il are effectively the same shape, but centred on slightly different wavelengths λr and λl, the intensity difference V = Ir − Il at each wavelength is approximately given by V = (1/2)×dI/dλ × Δλlos, where I(λ) = Ir(λ)+Il(λ). Using Eq. (2), this leads directly to
 (3)
(3)
As all the quantites in this equation except ⟨Bz⟩ can be measured at each point along the line profile, the many instances of this equation can be considered as a linear least squares problem to be solved for the slope ⟨Bz⟩ and its uncertainty by standard methods (Bagnulo et al. 2015; Bagnulo & Landstreet 2018).
(2) In the more general case where the two line profiles Ir and Il are significantly different because the Zeeman splitting is large enough to show clearly in the observed profiles, the separation Δλlos is evaluated numerically. It is easily shown that the expression to use is
 (4)
(4)
where the intensity I and circular polarisation V are expressed as function of velocity v relative to the central wavelength of the line λ0, Icont is the local continuum of the line being measured, g = 1.0, and c is the speed of light (Mathys 1989; Donati et al. 1997). The numerical application of this expression for WD fields is discussed at some length by Landstreet et al. (2015). (It should be noted that there is some uncertainty as to exactly where to place the zero-point for the measurements of the core depth Icont that appears in Eq. (2), which affects somewhat the field strength reported, but this does not affect the S/N of detection of a value of ⟨Bz⟩ that is significantly different from zero, as both the value of ⟨Bz⟩ and of its uncertainty are divided by the same denominator.)
Because the two polarised spectra required to obtain such a difference spectrum are obtained simultaneously through almost identical optical trains, the difference spectrum can be used to detect very small differences between the right and left circularly polarised spectra. In practice, for bright WDs, Stokes I and V spectra can be used to detect and measure magnetic fields ⟨Bz⟩ as small as 1 kG (Bagnulo & Landstreet 2018).
2.1. WD 1105–340
WD 1105–340 was observed as part of an ongoing survey of relatively bright (V < 15) white dwarfs for which low resolution spectroscopy (Subasavage et al. 2007) has shown that no field greater than about 1 MG is present, but for which measurements sensitive to a kG-level field have not been made. The basic parameters of this star are listed in Table 1; these are generally taken from the Gaia Collaboration (2016, 2018), from Gianninas et al. (2011), and from Subasavage et al. (2017). This star was observed with the high-resolution echelle spectropolarimeter ESPaDOnS on the Canada-France-Hawaii telescope, which produces a spectrum with a resolving power of R ≈ 65 000 over the range 3800 Å to 1.04 μm. Details of the observation are given in Table 2. A clear Zeeman triplet due to a magnetic field of ⟨|B|⟩ ∼ 120 kG was immediately recognised in Hα, as shown in Fig. 1. However, although the circular polarisation spectrum was also observed for this star, the S/N achieved was not sufficiently high to reveal Zeeman polarisation in any of the Balmer lines.
Parameters of new magnetic white dwarfs.
Observations of newly discovered magnetic white dwarfs.
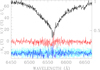 |
Fig. 1. Hα in the polarised spectrum of WD 1105–340 obtained with ESPaDOnS. The I flux spectrum (black) is normalised to 1.0 in the wings of Hα (the scale of the I spectrum is shown on the right side of the box). The circular polarisation V/I spectrum (red) is shown in %; the scale is on the left side. Below the PV = V/I spectrum is the NV spectrum, centred on −25%, with error bars for both PV and NV in light blue. The spectrum (originally acquired with R = 65 000) has been binned in boxes 0.5 Å wide to reduce visual noise without smearing the Zeeman pattern in the line core. |
This observation was followed up with one observation of Hα and a later observation of the Balmer lines Hβ through H8 using the FORS spectropolarimeter of the European Southern Observatory’s 8 m Antu telescope (see Table 2). The settings used on FORS yield a spectrum with resolving power of R ≈ 3600 over the range 5800–7300 Å, and a spectrum in the range 3670–5130 Å with R ≈ 2500. The resolving power of FORS was not high enough to show clear Zeeman splitting, but it is clear from the intensity spectrum that the core of Hα is quite abnormal The higher Balmer line cores appear fairly normal. The larger collecting area of the 8 m telescope made possible high S/N detection of a strong signal around each of the Balmer line cores in the circular polarisation spectra, clearly confirming the presence of a magnetic field on this star. These two spectra are illustrated in Figs. 2 and 3.
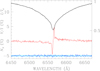 |
Fig. 2. The Hα polarised spectrum of WD 1105–340 observed with FORS. The scale of I is shown on the right side of the panel. The scale of PV = V/I, shown on the left side in %, is centred on 0.0%, while the scale of the null spectrum NV is centred on −5%. The broad blue band shows the uncertainties in PV and NV. |
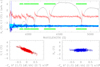 |
Fig. 3. The blue polarised spectrum of WD 1105–340 observed with FORS. The scale of I is arbitrary. The meaning of symbols in the upper panel is the same as in Fig. 2. The green bars above and below the spectra show the wavelength windows included in the computation of ⟨Bz⟩. Lower left panel: correlation of Stokes V/I with the local slope of the spectral line, while the lower right panel shows the same correlation for the null spectrum NV. |
Detailed analysis of these three spectra will be discussed in Sect. 3.1.
2.2. WD 2150+591
This object was identified as a probable new white dwarf member of the 20 pc volume around the Sun by Hollands et al. (2018) from a careful examination of the Gaia DR2 release. This star is labelled by Hollands et al. as 215139.93+591734.6(J2015.5); it is also identified as Gaia DR2 2202703050401536000. We will designate it as WD 2150+591. The parameters of the WD were taken from the Gaia Collaboration DR2 and from Hollands et al. (2018). The cooling age was estimated by interpolating in Table 1 of Bergeron et al. (1995).
We observed WD 2150+591 during an observing run with the ISIS spectropolarimeter of the William Herschel Telescope at the Observatorio del Roque de los Muchachos. This run was devoted primarily to searching for kG-level fields on stars of the 20 pc volume for which the available field strength limits are of the order of 1 MG. During this run, we observed simultaneously with the blue arm (R ≈ 4100, spectral range 3530–5370 Å) and with the red arm (R ≈ 10 500, spectral range 6000–7035 Å) of ISIS. Details of the observations of this star are given in Table 2. During the first observation, the shape of the (extremely weak) Hα line core showed clear Zeeman splitting characterised by a relatively sharp π component and quite broad σ components. However, the circular polarisation spectrum did not yield a clear detection of a magnetic signature. No higher Balmer line components are detected in our spectra of this DA star of Teff ≈ 5100 K, which is close to the temperature limit below which no Balmer lines are visible in the spectra of white dwarfs with H-rich atmospheres. No metal lines appear to be present in either the blue or the red spectra of WD 2150+591; there is no evidence from the optical spectrum connecting this very cool DA WD to the very interesting and growing class of cool DAZ stars with weak magnetic fields, such as NLTT 7547 (Kawka et al. 2019).
Because of the detection of the apparent Zeeman splitting in the first spectrum of this star, it was re-observed on two subsequent nights of the ISIS run. Due to an error in decker selection, the second spectrum lacks a background measurement, and cannot be measured reliably. The third spectrum showed the Zeeman triplet previously seen, and also yielded a detection of strong circular polarisation in the two σ components. Details of the three observations are reported in Table 2. The two useable spectra are illustrated in Fig. 4. Measurement of the spectra will be described in Sect. 3.2.
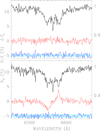 |
Fig. 4. The two polarised Hα spectra of WD 2150+591 obtained with ISIS (19 Sept: upper panel, 22 Sept: lower panel), binned in 1 Å bins to reduce noise. The meaning of the symbols is the same as in Fig. 2. |
3. Measurement of magnetic fields
3.1. WD1105–340
As discussed in the previous section, we can detect and measure both ⟨|B|⟩ and ⟨Bz⟩ on WD 1105–340. The ESPaDOnS spectrum of this star shows a clear Zeeman triplet in Hα when the data are binned in windows 0.5 Å wide. We can estimate the mean field modulus using Eq. (1). We have measured the π − σ separation both with eye estimates of the wavelength positions of the three components, and by fitting Gaussians to each component to measure its position. The two estimates yield essentially the same separation of 2.56 ± 0.1 Å, implying a field strength of 130 kG. This value means that only eight of the 600 or more MWDs with estimated field strengths (Ferrario et al. 2015) are known to have well-confirmed fields weaker than WD 1105–340.
The Hα FORS spectrum of WD 1105–340 has been obtained with a relatively low spectral resolution of around R ≈ 3600. With this resolving power, the resolution broadening of the core of Hα is comparable to the separation of the Zeeman components. Thus the unusual width of the core is clear in the I spectrum, but the components are not separated. We have carried out some simple numerical Hα line core modelling, using the spectrum synthesis program ZEEMAN.F as described by Landstreet et al. (2017), and find that the model line core has the same width as the FORS line core for a field of ⟨|B|⟩ ≈ 160 ± 15 kG. The blue FORS spectrum of WD 1105–340 does not display enough broadening to estimate ⟨|B|⟩.
The initial polarised ESPaDOnS spectrum of WD 1105–340 showed a clear Zeeman pattern in I, but the S/N ratio of the Stokes V signal was not high enough to provide a secure detection of Zeeman polarisation. However, the observed signal still allows us to measure the mean line-of-sight component of the field averaged over the visible hemisphere, ⟨Bz⟩.
Using Eq. (4) on the ESPaDOnS spectrum of WD 1105–340, we find a value of ⟨Bz⟩ that is not significantly different from zero, so this measure does not provide confirming evidence of the presence of a magnetic field on WD 1105–340. However, it does provide quite a strong constraint on the ⟨Bz⟩ field strength at the moment of observation.
The low-resolution red FORS polarised spectrum of WD 1105–340, as noted above, does not permit a very precise measurement of ⟨|B|⟩, but it does provide a very convincing detection of the longitudinal magnetic field, with peak values of the polarisation V/I of about ±4%, detected with more than 15σ significance in the characteristic S-shaped polarisation signal. When this polarisation signal is used to determine the value of ⟨Bz⟩ using the correlation method based on Eq. (3), as discussed in Sect. 2, the deduced field strength is −20.5 ± 1 kG. This value is probably an underestimate of the magnitude of the actual ⟨Bz⟩ field value, as the splitting in Hα is large enough that the underlying assumption of a nearly unperturbed line core is no longer very accurate.
We have also derived a value of ⟨Bz⟩ from the Hα FORS spectrum by measuring the separation between the mean wavelength of the line core as observed in right and left circularly polarised light, using the same numerical method to evaluate Eq. (4) as was employed for the observation with ESPaDOnS. In this case, the field strength is found to be −30.3 ± 1.0 kG, a somewhat larger absolute value than derived using the correlation method, as expected. We adopt this value as being very probably more accurate than that obtained with the correlation technique.
In contrast, the Stokes I profiles of the higher Balmer lines of the blue FORS spectrum of WD 1105–340 are perturbed little enough that using the normal correlation method based on Eq. (3) is expected to have acceptable accuracy. For this spectrum, the derived value of ⟨Bz⟩ is −31.5 ± 0.6 kG. The magnetic measurements of WD 1105–340 are summarised in Table 2.
The values of ⟨Bz⟩ derived from the three available spectra clearly indicate that the line-of-sight component of the magnetic field of WD 1105–340 is variable, with a currently unknown period. Note this conclusion is not affected by the lack of detection of a non-zero ⟨Bz⟩ field in the ESPaDOnS spectrum, because all measurements are sufficiently precise to clearly establish that they are very different. Further observations are expected to provide a rotation period for this star, and sufficient data to allow simple modelling of the global structure of the field, as has been described for the weak-field MWDs WD 2047+372 and WD 2359–434 Landstreet et al. (2017).
3.2. WD 2150+591
The temperature estimated for WD 2150+591 by Hollands et al. (2018) is Teff = 5095 K. With this effective temperature, only Hα is usefully detectable in the spectrum. On this star Hα is a few percent deep, and is easily seen to be split by the Zeeman effect due to a field of several hundred kG. The mean field modulus may be estimated using a measurement of the π − σ separation based on eye estimates of the centroid wavelength of each component, or by fitting Gaussians to each component. Although the σ components are quite broad, the results of the the two methods are in good agreement, and lead to separation estimates of 16.4 and 14.1 Å for the observations on Sept 19 and 22, which in turn suggest varying values of ⟨|B|⟩ ranging at least between ⟨|B|⟩ ≈ 820 and 700 kG.
The polarisation data from these observations can clearly not be analysed successfully by the correlation method used for measurement of very weak fields, the method used to analyse most of our previous magnetic observations with ESO-FORS (Bagnulo et al. 2015). This is because the complete separation of the π and σ components means that the strongest polarisation signals are correlated not with the slope of the blended line components but with the individual depths of the σ components. However, analysis of the separation between line centroids as seen in right and left circular polarisation, using Eq. (4), works very well. This method reveals that on Sept. 19 the longitudinal field ⟨Bz⟩ was quite close to zero, while on Sept. 22 it was nearly −260 kG.
It is clear from these data that the magnetic field of WD 2150+591 is very securely detected, that it can be measured with considerable accuracy using the spectropolarimeters available in the northern hemisphere, and that the field is variable on a time scale of hours or days. Future observations should provide the rotation period of this star, and allow simple modelling of the geometry of the magnetic field distribution over the stellar surface. The magnetic measurements of WD 2150+591 are summarised in Table 2.
4. Preliminary modelling of field structure
With only two or three observations for each of the two newly discovered MWDs, we are not able to constrain the surface distribution of magnetic flux over each star very tightly. However, we can begin to extract even from such limited measurements some useful information about possible models.
The basic simple model normally used as a first approximation for the field structure of a MWD is the surface magnetic flux distribution produced by a magnetic dipole at the centre of the star. The justification for using this model is that when we measure a value of |⟨Bz⟩| that is a substantial fraction (say, 20% or more) of ⟨|B|⟩, we can deduce that the global structure of the stellar field is such that there is one hemisphere that has most magnetic flux lines entering the star, while on the other hemisphere most flux lines are emerging. In the contrasting situation of a lot of small-scale magnetic structure, as on the surface of the Sun, much local cancellation of field contributions to ⟨Bz⟩ occurs, and |⟨Bz⟩| is much smaller than ⟨|B|⟩. A centred dipole (or indeed a uniform field with all field lines through the star parallel to one another) captures this tendency towards relatively simple large-scale coherence with a small number of parameters.
The required parameters of a dipole model are the surface field strength on the magnetic axis at one of the poles Bd, the obliquity β of the dipole axis to the rotation axis, and the inclination i of the rotation axis to the line of sight to the star.
If we limit ourselves to models of this class, the variability of ⟨Bz⟩ observed in the observations of each of the new MWDs immediately provides real constraints. (1) It is clear that i must be significantly different from zero, for otherwise we would observe no variations in ⟨Bz⟩ regardless of the values of β and Bd. (2) Similarly, β must be substantially different from zero, or again we would detect no variation in ⟨Bz⟩ independently of the values of i and Bd. (3) We can estimate that Bd will probably be at least 20 or 30% larger than the largest value of ⟨|B|⟩ observed. (4) Consider the sets of observations obtained for each star. Unusually, one observation of each has the property that ⟨Bz⟩ is very close to zero, while in the other observation(s) |⟨Bz⟩|∼0.2⟨|B|⟩, as on WD 1105–340, or even 0.37⟨|B|⟩, as on WD 2150+591. In the case of nearly zero ⟨Bz⟩, the line of sight appears to point roughly towards the magnetic equator, while in the case with a large value of |⟨Bz⟩|, the line of sight points roughly toward a magnetic pole.
Thus for WD 1105–340, we arrive at a first guess model of a simple centred dipole with both i and β quite different from zero, and Bd ∼ 150 kG. For WD 2150+591 our first guess model is also a simple centred dipole with both angles large, and Bd ∼ 900 kG.
However, there is a striking difference between the appearance of the Hα lines of WD 1105–340 and WD 2150+591 that should provide additional information about the field structure. For WD 1105–340, the two σ components of the resolved Zeeman pattern seen in the ESPaDOnS data (Fig. 1) are about the same width as the central π component, suggesting that the dispersion in the local field strength |B| over the visible hemisphere is small compared to its mean value. In contrast, the σ components of WD 2150+591 are so broad (Fig. 4) that it is clear that the dispersion in local |B| is of the same order as the mean value.
In part this difference between WD 1105–340 and WD 2150+591 may be due to the much stronger field present on WD 2150+591, which leads to significant variation in the wavelengths of the σ components due to even moderate variations in the local value of |B|. However, this difference between the two stars in the width of the σ components relative to the π component is similar to the difference noted between WD 2047+372 (with ⟨|B|⟩ = 60 kG and very well-defined σ components) and WD 2359–434 (with ⟨|B|⟩ ∼ 50 − 100 kG and very diffuse σ components) (Landstreet et al. 2017). For that pair of stars, the different appearance of the σ components was apparently a symptom of rather different global magnetic field structures, with that of the young star WD 2047+372 being “simpler” than that of the considerably older WD 2359–434. We suspect that this difference may also be present on this pair of stars between the relatively young WD 1105–340 and the much older WD 2150+591.
With the limited data available, we will not try to refine these modelling ideas further, but it is clear that if we can determine the rotation period of each star, and obtain several polarised spectra spread through the rotation period, we should be able to obtain plausible, and much better constrained, models of the strength and structure of the magnetic field over the stellar surface.
5. Discussion and conclusions
In this paper we have reported the firm detection of sub-MG magnetic fields on two relatively bright DA white dwarfs. WD 1105–340 has a field which, assuming that it can be at least roughly described as that of a dipole with its axis at a non-zero angle to the rotation axis, probably has a polar dipole field strength of order 150 kG. WD 2150+591 may have a very roughly dipolar field as well, with a polar field strength of the order of 900 kG.
The discovery of these fields is significant for several reasons. First, we have increased the small sample of 21 MWDs known to have sub-MG fields by two, or by about 10%. Since this range of field strength covers almost half of the full known (logarithmic) field strength range, these are clearly valuable additions to a rather poorly known field strength domain.
Secondly, both the newly discovered kG-level MWDs are brighter than mV = 15. Only about ten of the previously known sub-MG MWDs are this bright. The practical importance of this characteristic is that such stars are far easier to study in detail, for example by identifying rotation periods and mapping the surface magnetic field structure, using available 4 m class telescopes, than the weak-field MWDs of magnitude 16 or 17. And because both new MWDs are clearly magnetically variable, they are both particularly well-suited to detailed study.
Thirdly, both stars are members of WD samples that are of substantial interest. They both qualify as members of the magnitude-limited samples that are often used for establishing the frequency of occurrence of MWDs of various types. Thus the discovery of fields in these two stars will change the best estimates of what fraction of WDs have detectable fields, and of the distribution of field strengths over the magnetic sub-sample.
Furthermore, WD 2150+591 is also within the 20-pc sample of white dwarfs, the best current proxy for studying observationally the time evolution of the final stages of evolution of a fixed sample of stars in the Milky Way (Giammichele et al. 2012; Holberg et al. 2016; Hollands et al. 2018).
Another significant feature of both these new MWDs (kindly pointed out by the referee) is that both are members of wide binary systems consisting of a white dwarf and a low-mass main sequence star. As there is considerable interest currently in the possibility that (some?) WD magnetism is a consequence of binary evolution through a common envelope phase (Tout et al. 2008; Ferrario et al. 2015; Briggs et al. 2018), the presence of weak fields in WD members of such binary systems is of considerable interest. Note, however, that in both systems the current separation of the WD and the M dwarf is of the order of 100 AU, so that the two stars may have effectively evolved this far as single objects.
Finally, it appears that these two MWDs are consistent with the idea that the surface field structures of young and old white dwarfs may well be rather different from one another in terms of complexity. Remarkably, a similar contrast, between an apparently simple magnetic field structure on the relatively young white dwarf WD 2047+372 and a more complex one on the older white dwarf WD 2359–434, was reported recently by Landstreet et al. (2017). This difference could turn out to be an evolutionary effect that may be a useful clue about how a MWD field evolves as the underlying star cools.
Thus both of these new MWDs are well worth monitoring for modelling purposes, and we plan to obtain further observations in the near future.
Acknowledgments
We thank the anonymous referee for several helpful suggestions and improvements. JDL acknowledges the support of the Natural Sciences and Engineering Research Council of Canada (NSERC), funding reference number 6377-2016.
References
- Angel, J. R. P. 1978, ARA&A, 16, 487 [NASA ADS] [CrossRef] [Google Scholar]
- Angel, J. R. P., & Landstreet, J. D. 1971, ApJ, 164, L15 [NASA ADS] [CrossRef] [Google Scholar]
- Aznar Cuadrado, R., Jordan, S., Napiwotzki, R., et al. 2004, A&A, 423, 1081 [NASA ADS] [CrossRef] [EDP Sciences] [Google Scholar]
- Bagnulo, S., & Landstreet, J. D. 2015, in Stellar Magnetic Fields, eds. L. Kolokolova, J. Hough, & A. C. Levasseur-Regourd, 224 [Google Scholar]
- Bagnulo, S., & Landstreet, J. D. 2018, A&A, 618, A113 [NASA ADS] [CrossRef] [EDP Sciences] [Google Scholar]
- Bagnulo, S., Fossati, L., Landstreet, J. D., & Izzo, C. 2015, A&A, 583, A115 [NASA ADS] [CrossRef] [EDP Sciences] [Google Scholar]
- Bergeron, P., Wesemael, F., & Beauchamp, A. 1995, PASP, 107, 1047 [NASA ADS] [CrossRef] [Google Scholar]
- Briggs, G. P., Ferrario, L., Tout, C. A., & Wickramasinghe, D. T. 2018, MNRAS, 481, 3604 [NASA ADS] [CrossRef] [Google Scholar]
- Donati, J.-F., & Landstreet, J. D. 2009, ARA&A, 47, 333 [NASA ADS] [CrossRef] [MathSciNet] [Google Scholar]
- Donati, J.-F., Semel, M., Carter, B. D., Rees, D. E., & Collier Cameron, A. 1997, MNRAS, 291, 658 [NASA ADS] [CrossRef] [MathSciNet] [Google Scholar]
- Ferrario, L., de Martino, D., & Gänsicke, B. T. 2015, Space Sci. Rev., 191, 111 [NASA ADS] [CrossRef] [Google Scholar]
- Gaia Collaboration (Prusti, T., et al.) 2016, A&A, 595, A1 [NASA ADS] [CrossRef] [EDP Sciences] [Google Scholar]
- Gaia Collaboration (Brown, A. G. A., et al.) 2018, A&A, 616, A1 [NASA ADS] [CrossRef] [EDP Sciences] [Google Scholar]
- Giammichele, N., Bergeron, P., & Dufour, P. 2012, ApJS, 199, 29 [NASA ADS] [CrossRef] [Google Scholar]
- Gianninas, A., Bergeron, P., & Ruiz, M. T. 2011, ApJ, 743, 138 [NASA ADS] [CrossRef] [Google Scholar]
- Holberg, J. B., Oswalt, T. D., Sion, E. M., & McCook, G. P. 2016, MNRAS, 462, 2295 [NASA ADS] [CrossRef] [Google Scholar]
- Hollands, M. A., Tremblay, P.-E., Gänsicke, B. T., Gentile-Fusillo, N. P., & Toonen, S. 2018, MNRAS, 480, 3942 [NASA ADS] [CrossRef] [Google Scholar]
- Kawka, A., & Vennes, S. 2014, MNRAS, 439, L90 [NASA ADS] [CrossRef] [Google Scholar]
- Kawka, A., Vennes, S., Ferrario, L., & Paunzen, E. 2019, MNRAS, 482, 5201 [NASA ADS] [CrossRef] [Google Scholar]
- Kemp, J. C., Swedlund, J. B., Landstreet, J. D., & Angel, J. R. P. 1970, ApJ, 161, L77 [NASA ADS] [CrossRef] [Google Scholar]
- Kepler, S. O., Pelisoli, I., Koester, D., et al. 2016, VizieR Online Data Catalog: J/MNRAS/455/3413 [Google Scholar]
- Koester, D., Voss, B., Napiwotzki, R., et al. 2009, A&A, 505, 441 [NASA ADS] [CrossRef] [EDP Sciences] [Google Scholar]
- Landstreet, J. D. 1992, A&ARv, 4, 35 [NASA ADS] [CrossRef] [Google Scholar]
- Landstreet, J. D., & Angel, J. R. P. 1971, ApJ, 165, L67 [NASA ADS] [CrossRef] [Google Scholar]
- Landstreet, J. D., Bagnulo, S., Valyavin, G. G., et al. 2015, A&A, 580, A120 [NASA ADS] [CrossRef] [EDP Sciences] [Google Scholar]
- Landstreet, J. D., Bagnulo, S., Valyavin, G., & Valeev, A. F. 2017, A&A, 607, A92 [NASA ADS] [CrossRef] [EDP Sciences] [Google Scholar]
- Mathys, G. 1989, Fund. Cosmic Phys., 13, 143 [Google Scholar]
- Schmidt, G. D., & Smith, P. S. 1994, ApJ, 423, L63 [NASA ADS] [CrossRef] [Google Scholar]
- Schmidt, G. D., Harris, H. C., Liebert, J., et al. 2003, ApJ, 595, 1101 [NASA ADS] [CrossRef] [Google Scholar]
- Subasavage, J. P., Henry, T. J., Bergeron, P., et al. 2007, AJ, 134, 252 [NASA ADS] [CrossRef] [Google Scholar]
- Subasavage, J. P., Jao, W.-C., Henry, T. J., et al. 2017, AJ, 154, 32 [NASA ADS] [CrossRef] [Google Scholar]
- Tout, C. A., Wickramasinghe, D. T., Liebert, J., Ferrario, L., & Pringle, J. E. 2008, MNRAS, 387, 897 [NASA ADS] [CrossRef] [Google Scholar]
- Tremblay, P.-E., Fontaine, G., Freytag, B., et al. 2015, ApJ, 812, 19 [NASA ADS] [CrossRef] [Google Scholar]
All Tables
All Figures
|
Fig. 1. Hα in the polarised spectrum of WD 1105–340 obtained with ESPaDOnS. The I flux spectrum (black) is normalised to 1.0 in the wings of Hα (the scale of the I spectrum is shown on the right side of the box). The circular polarisation V/I spectrum (red) is shown in %; the scale is on the left side. Below the PV = V/I spectrum is the NV spectrum, centred on −25%, with error bars for both PV and NV in light blue. The spectrum (originally acquired with R = 65 000) has been binned in boxes 0.5 Å wide to reduce visual noise without smearing the Zeeman pattern in the line core. |
| In the text | |
|
Fig. 2. The Hα polarised spectrum of WD 1105–340 observed with FORS. The scale of I is shown on the right side of the panel. The scale of PV = V/I, shown on the left side in %, is centred on 0.0%, while the scale of the null spectrum NV is centred on −5%. The broad blue band shows the uncertainties in PV and NV. |
| In the text | |
|
Fig. 3. The blue polarised spectrum of WD 1105–340 observed with FORS. The scale of I is arbitrary. The meaning of symbols in the upper panel is the same as in Fig. 2. The green bars above and below the spectra show the wavelength windows included in the computation of ⟨Bz⟩. Lower left panel: correlation of Stokes V/I with the local slope of the spectral line, while the lower right panel shows the same correlation for the null spectrum NV. |
| In the text | |
|
Fig. 4. The two polarised Hα spectra of WD 2150+591 obtained with ISIS (19 Sept: upper panel, 22 Sept: lower panel), binned in 1 Å bins to reduce noise. The meaning of the symbols is the same as in Fig. 2. |
| In the text | |
Current usage metrics show cumulative count of Article Views (full-text article views including HTML views, PDF and ePub downloads, according to the available data) and Abstracts Views on Vision4Press platform.
Data correspond to usage on the plateform after 2015. The current usage metrics is available 48-96 hours after online publication and is updated daily on week days.
Initial download of the metrics may take a while.