Fig. 3.
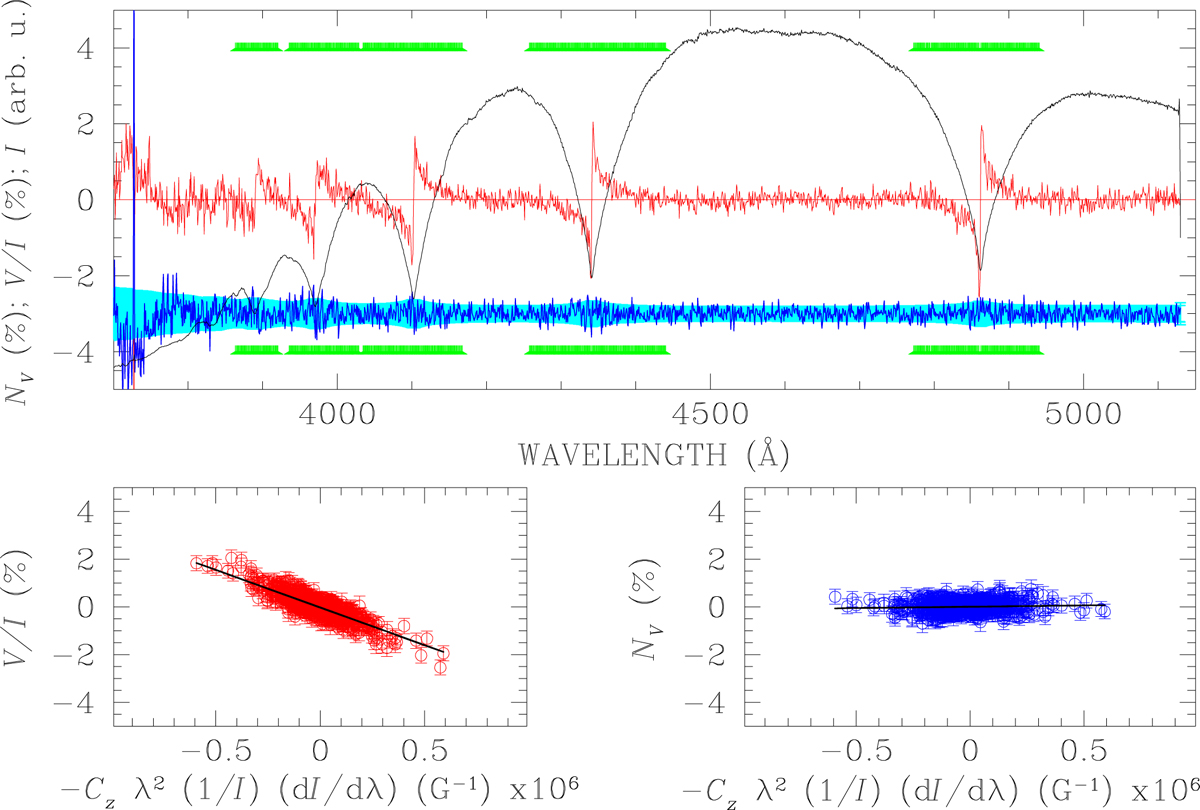
The blue polarised spectrum of WD 1105–340 observed with FORS. The scale of I is arbitrary. The meaning of symbols in the upper panel is the same as in Fig. 2. The green bars above and below the spectra show the wavelength windows included in the computation of ⟨Bz⟩. Lower left panel: correlation of Stokes V/I with the local slope of the spectral line, while the lower right panel shows the same correlation for the null spectrum NV.
Current usage metrics show cumulative count of Article Views (full-text article views including HTML views, PDF and ePub downloads, according to the available data) and Abstracts Views on Vision4Press platform.
Data correspond to usage on the plateform after 2015. The current usage metrics is available 48-96 hours after online publication and is updated daily on week days.
Initial download of the metrics may take a while.