Free Access
Fig. 6.
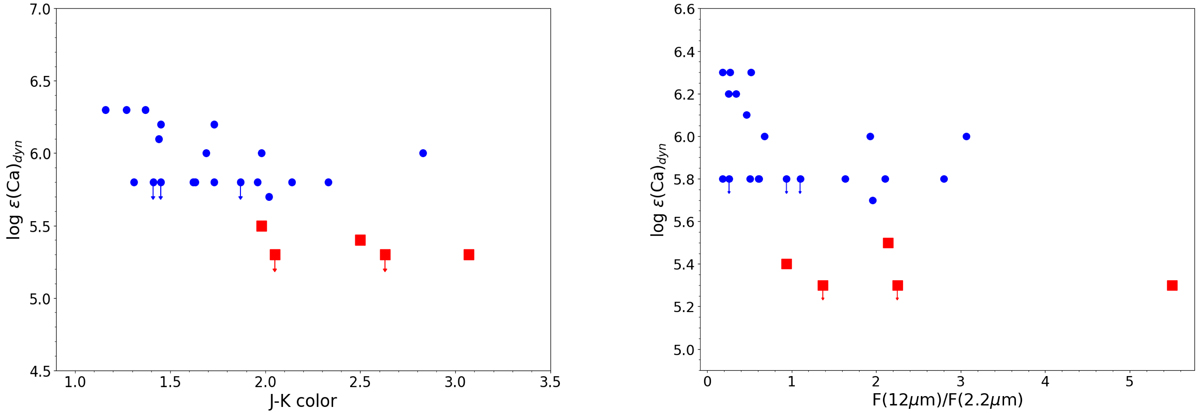
Ca abundances derived with pseudo-dynamical models against the J–K colours (left panel) and infrared excesses R = F(12 μm)/F(2.2 μm) (right panel). The five stars with the largest Ca depletion values are shown by red squares and upper limits are indicated by vertical arrows.
Current usage metrics show cumulative count of Article Views (full-text article views including HTML views, PDF and ePub downloads, according to the available data) and Abstracts Views on Vision4Press platform.
Data correspond to usage on the plateform after 2015. The current usage metrics is available 48-96 hours after online publication and is updated daily on week days.
Initial download of the metrics may take a while.