Free Access
Fig. 3.
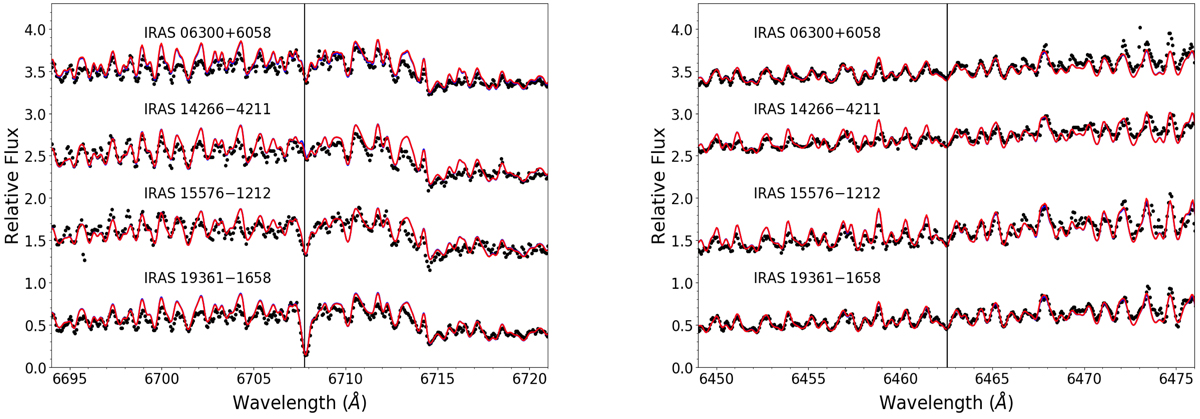
Li I 6708 Å (left panel) and Ca I 6463 Å (right panel) spectral regions in four massive Galactic AGB stars. The hydrostatic models (blue lines) and the pseudo-dynamical models (red lines) that best fit the observations (black dots) are shown. The location of the Li I and the Ca I lines are indicated by black vertical lines.
Current usage metrics show cumulative count of Article Views (full-text article views including HTML views, PDF and ePub downloads, according to the available data) and Abstracts Views on Vision4Press platform.
Data correspond to usage on the plateform after 2015. The current usage metrics is available 48-96 hours after online publication and is updated daily on week days.
Initial download of the metrics may take a while.