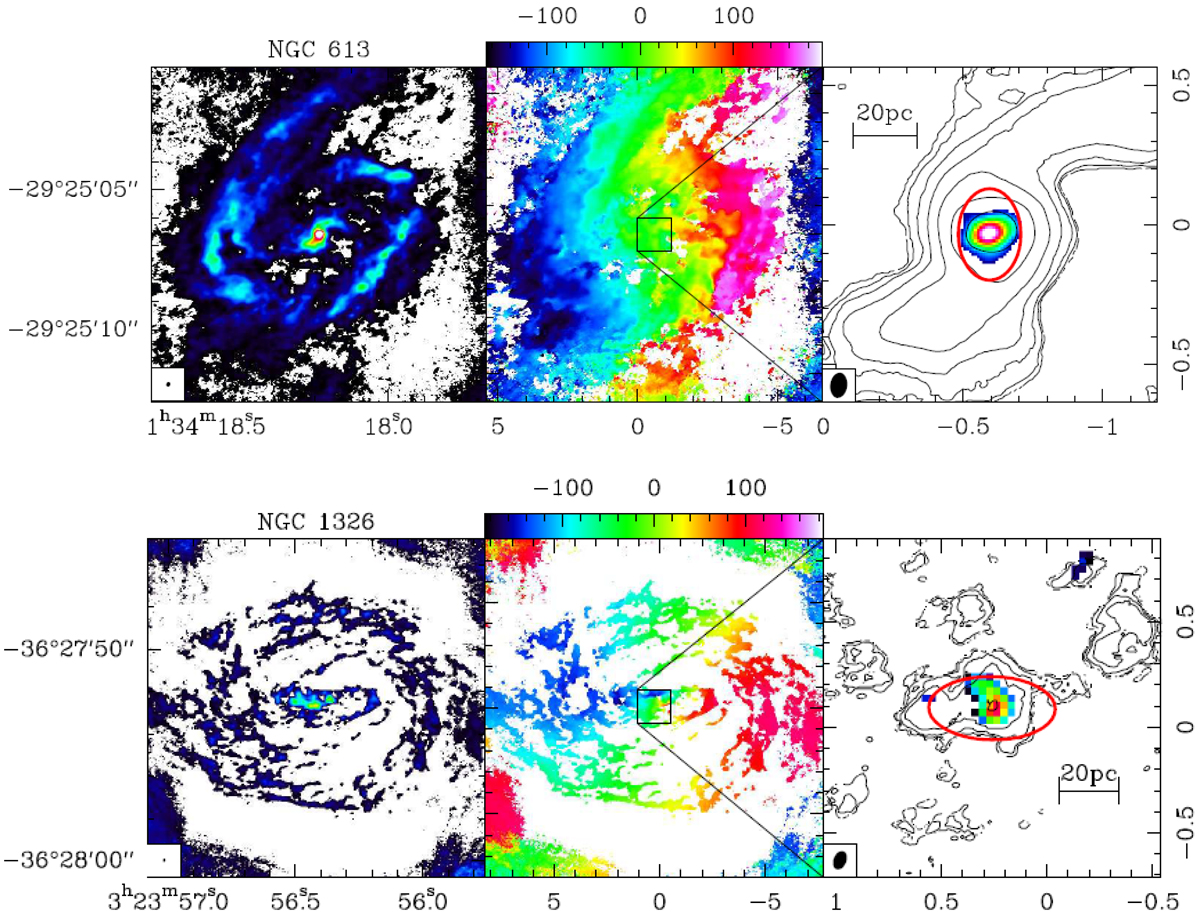
Fig. 2.

Top panel: CO(3-2) moment 0 and 1 of galaxy NGC 613 (left and middle, TE+TM1). Right panel: zoom-in of the CO(3-2) contours (of the TM1 observations at high resolution) superposed on a color scale of the continuum emission in Band 7. The three panels have been centered on the central continuum source, and the labels are the offset in arcseconds from the phase center. For the two first panels the beam size is indicated at the bottom left. In the third panel is shown the ellipse (in red) used to define the molecular tori in Sect. 4.3. The contours are from 25σ to 1600σ, and follow each other by factor 2 multiplication. The scale bar in the right panel is 20 pc long. The color scale in the middle panel is in km s−1. Bottom panel: same, but for galaxy NGC 1326. The contours are from 3σ to 96σ, and follow each other by factor 2 multiplication.
Current usage metrics show cumulative count of Article Views (full-text article views including HTML views, PDF and ePub downloads, according to the available data) and Abstracts Views on Vision4Press platform.
Data correspond to usage on the plateform after 2015. The current usage metrics is available 48-96 hours after online publication and is updated daily on week days.
Initial download of the metrics may take a while.


