Fig. 9
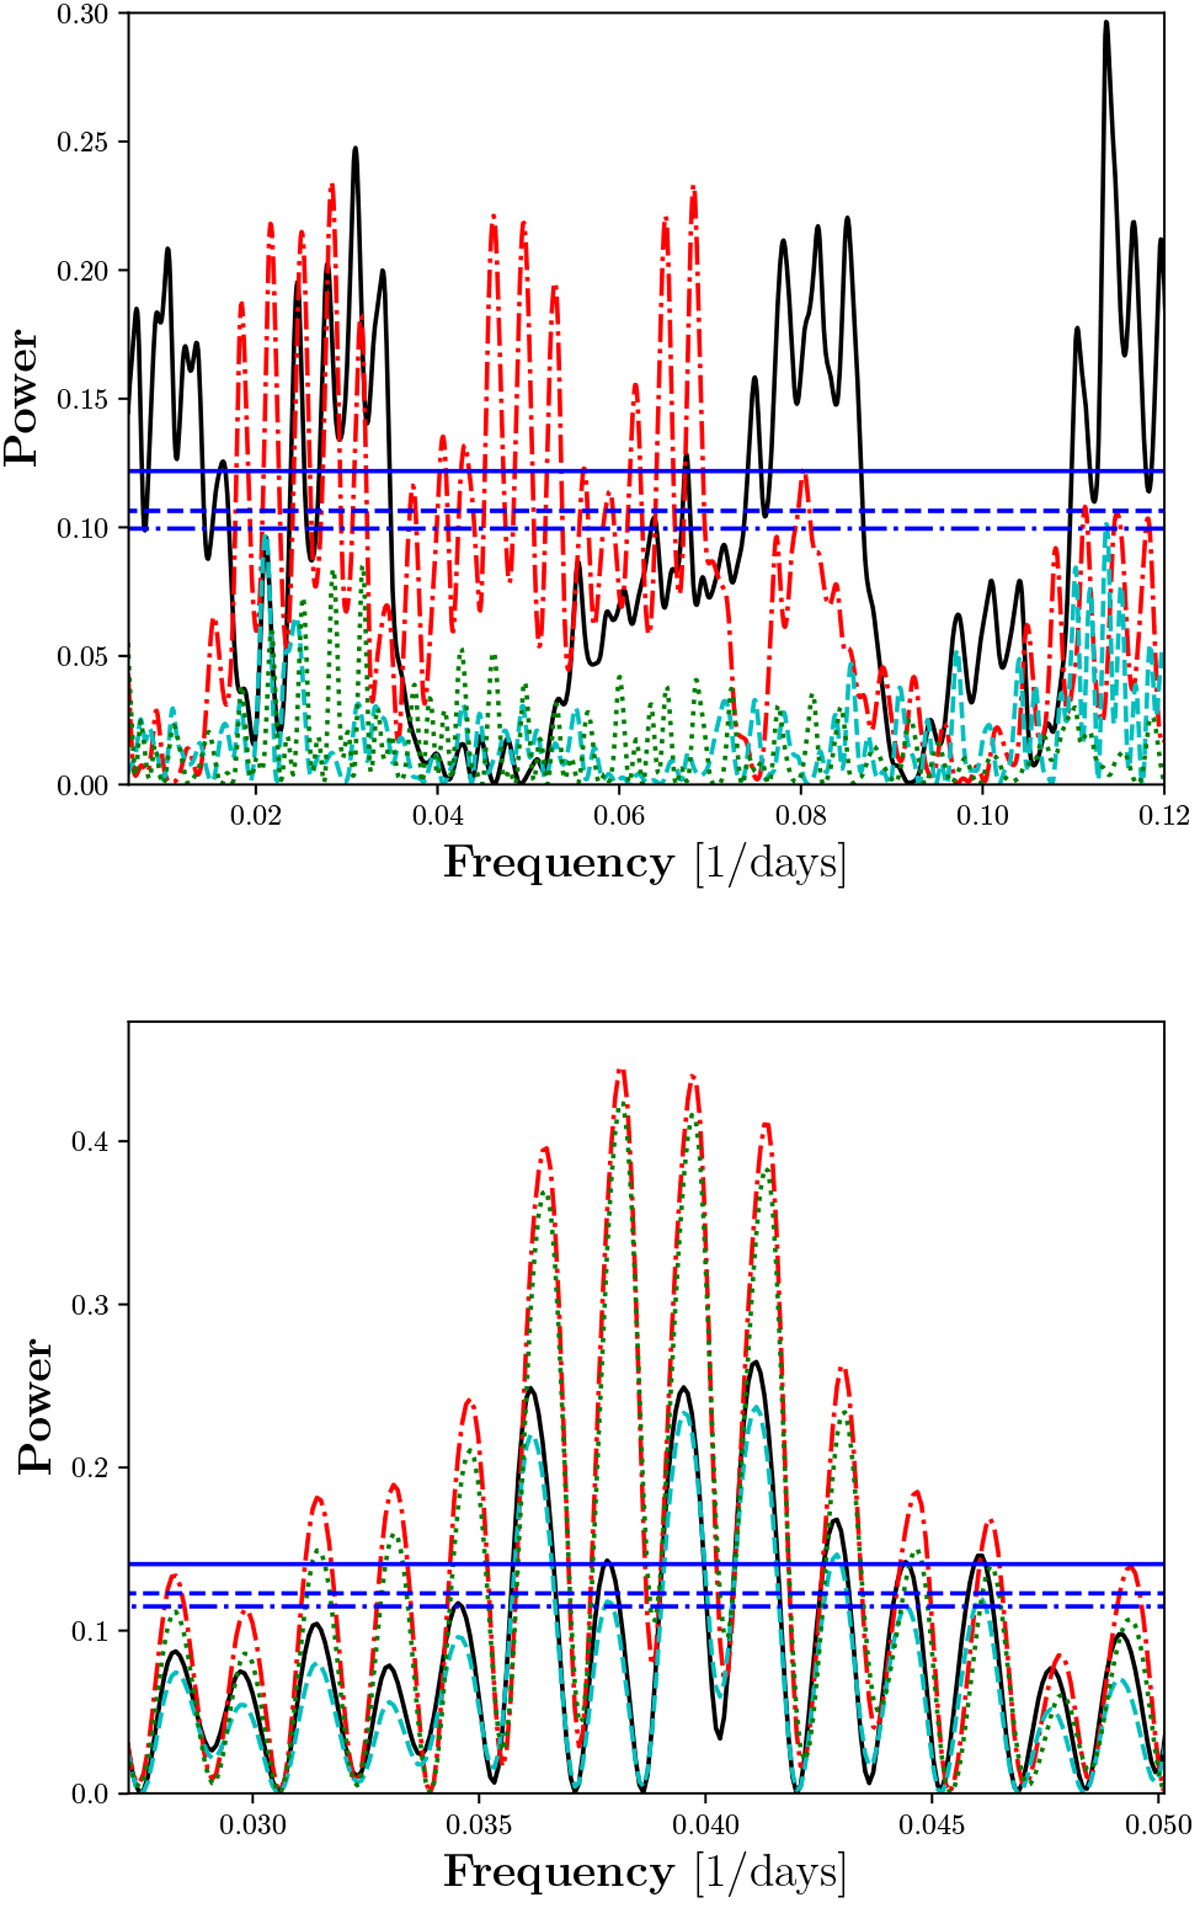
Influence of multiple spectra taken on one night on the GLS periodogram. Black/solid and red/dash-dotted denote the power for IHα and ICa,1, respectively, including multiple spectra. Cyan/dashed and green/dotted denote the power for IHα and ICa,1, respectively, excluding multiple spectra. The horizontal blue lines show the FAP levels of 0.1 (dash-dotted), 0.05 (dashed), and 0.01 (solid). Top panel: the extreme case of GX And. Bottom panel: the typical case of BD 21652.
Current usage metrics show cumulative count of Article Views (full-text article views including HTML views, PDF and ePub downloads, according to the available data) and Abstracts Views on Vision4Press platform.
Data correspond to usage on the plateform after 2015. The current usage metrics is available 48-96 hours after online publication and is updated daily on week days.
Initial download of the metrics may take a while.