Fig. 8
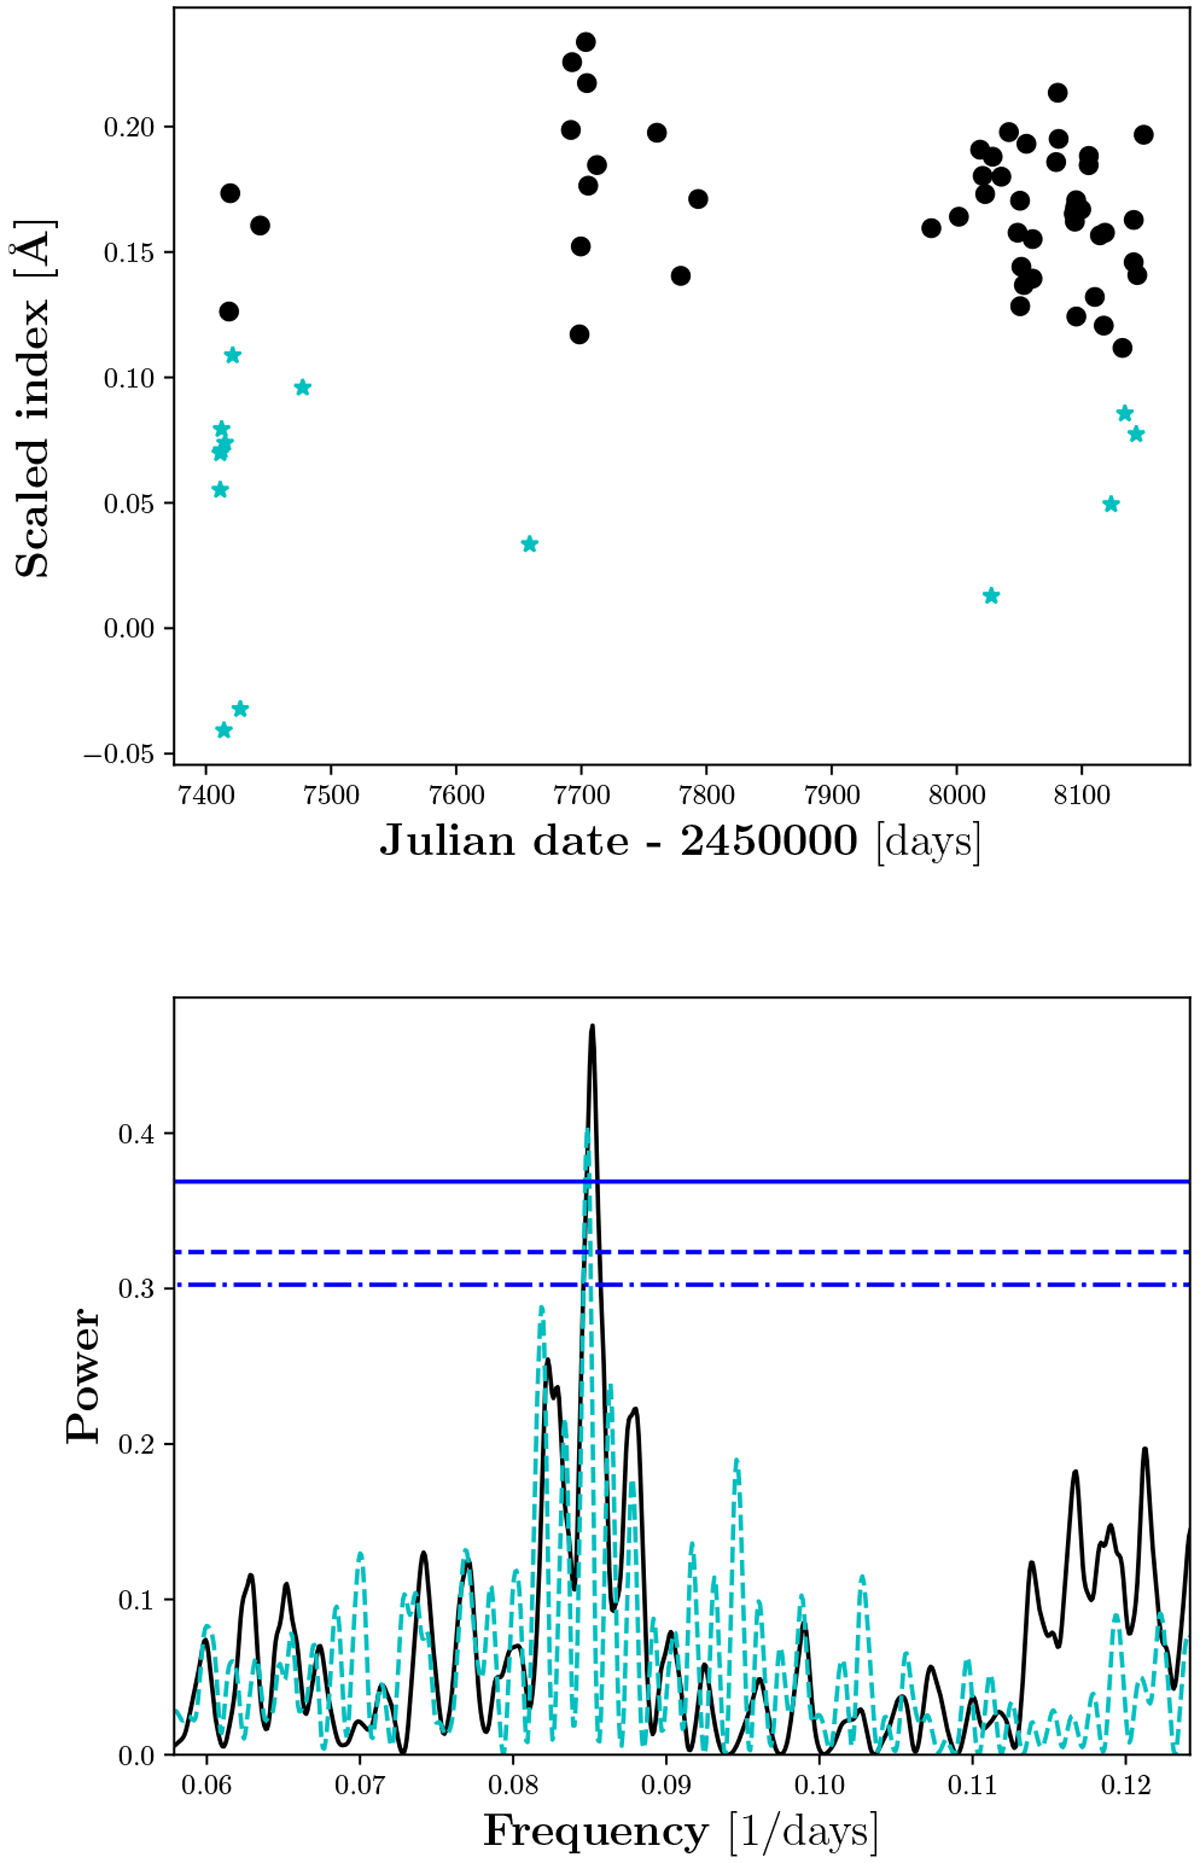
Influence of flaring spectra for V2689 Ori. Top panel: index time series of I(H α) with (cyan) and without (black) flare-flagged spectra. Bottom panel: comparison of the GLS with inclusion of flare-contaminated spectra (cyan/dashed) and without (black/solid). The horizontal blue lines show the FAP levels of 0.1 (dash-dotted), 0.05 (dashed), and 0.01 (solid).
Current usage metrics show cumulative count of Article Views (full-text article views including HTML views, PDF and ePub downloads, according to the available data) and Abstracts Views on Vision4Press platform.
Data correspond to usage on the plateform after 2015. The current usage metrics is available 48-96 hours after online publication and is updated daily on week days.
Initial download of the metrics may take a while.