Fig. 5
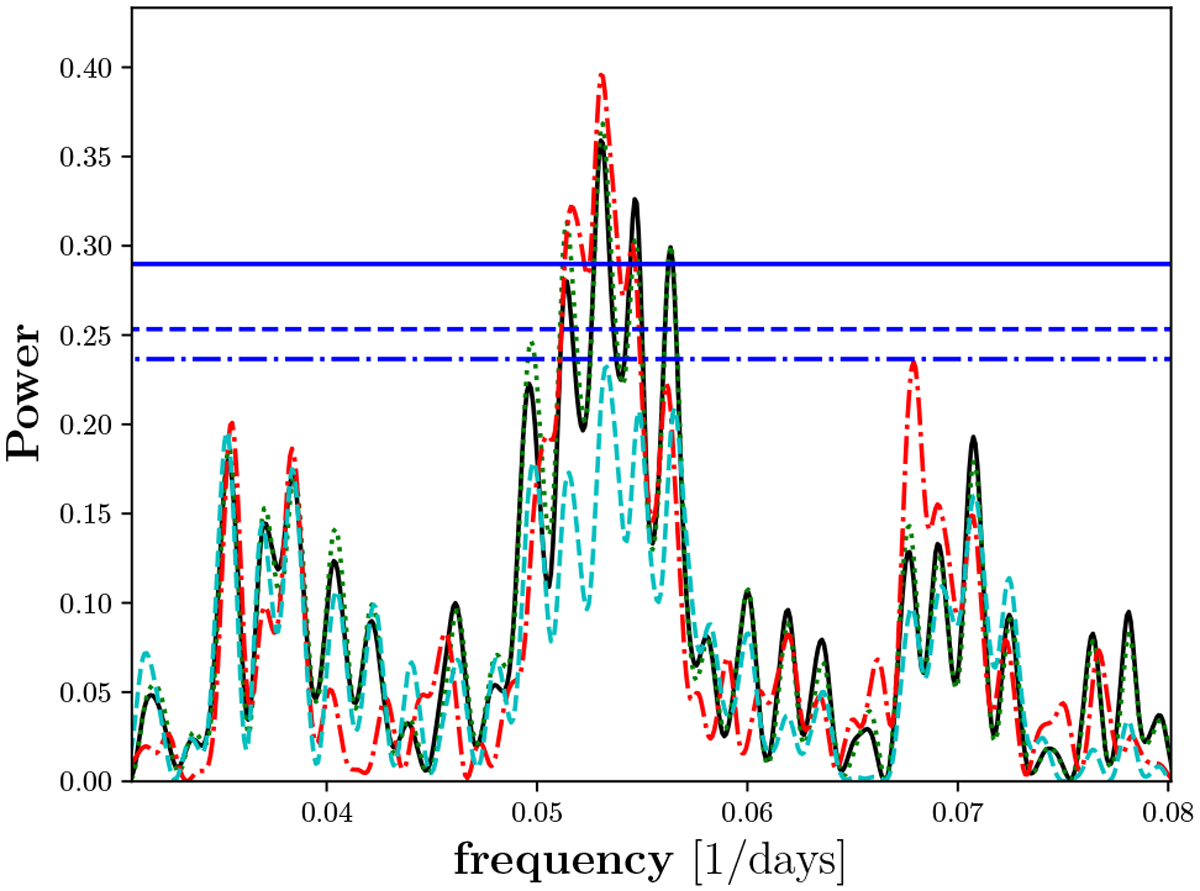
Periodogram comparing the different central wavelength ranges of Hα for BD+61 195. The pEW A1 is designated by the black line, the core pEW A2 is in green/dotted, the pEW with broad central wavelength range A3 is in cyan/dashed, and the pEW with variable width A4 is in red/dot-dashed. The horizontal blue lines show the FAP levels of 0.1 (dash-dotted), 0.05 (dashed), and 0.01 (solid).
Current usage metrics show cumulative count of Article Views (full-text article views including HTML views, PDF and ePub downloads, according to the available data) and Abstracts Views on Vision4Press platform.
Data correspond to usage on the plateform after 2015. The current usage metrics is available 48-96 hours after online publication and is updated daily on week days.
Initial download of the metrics may take a while.