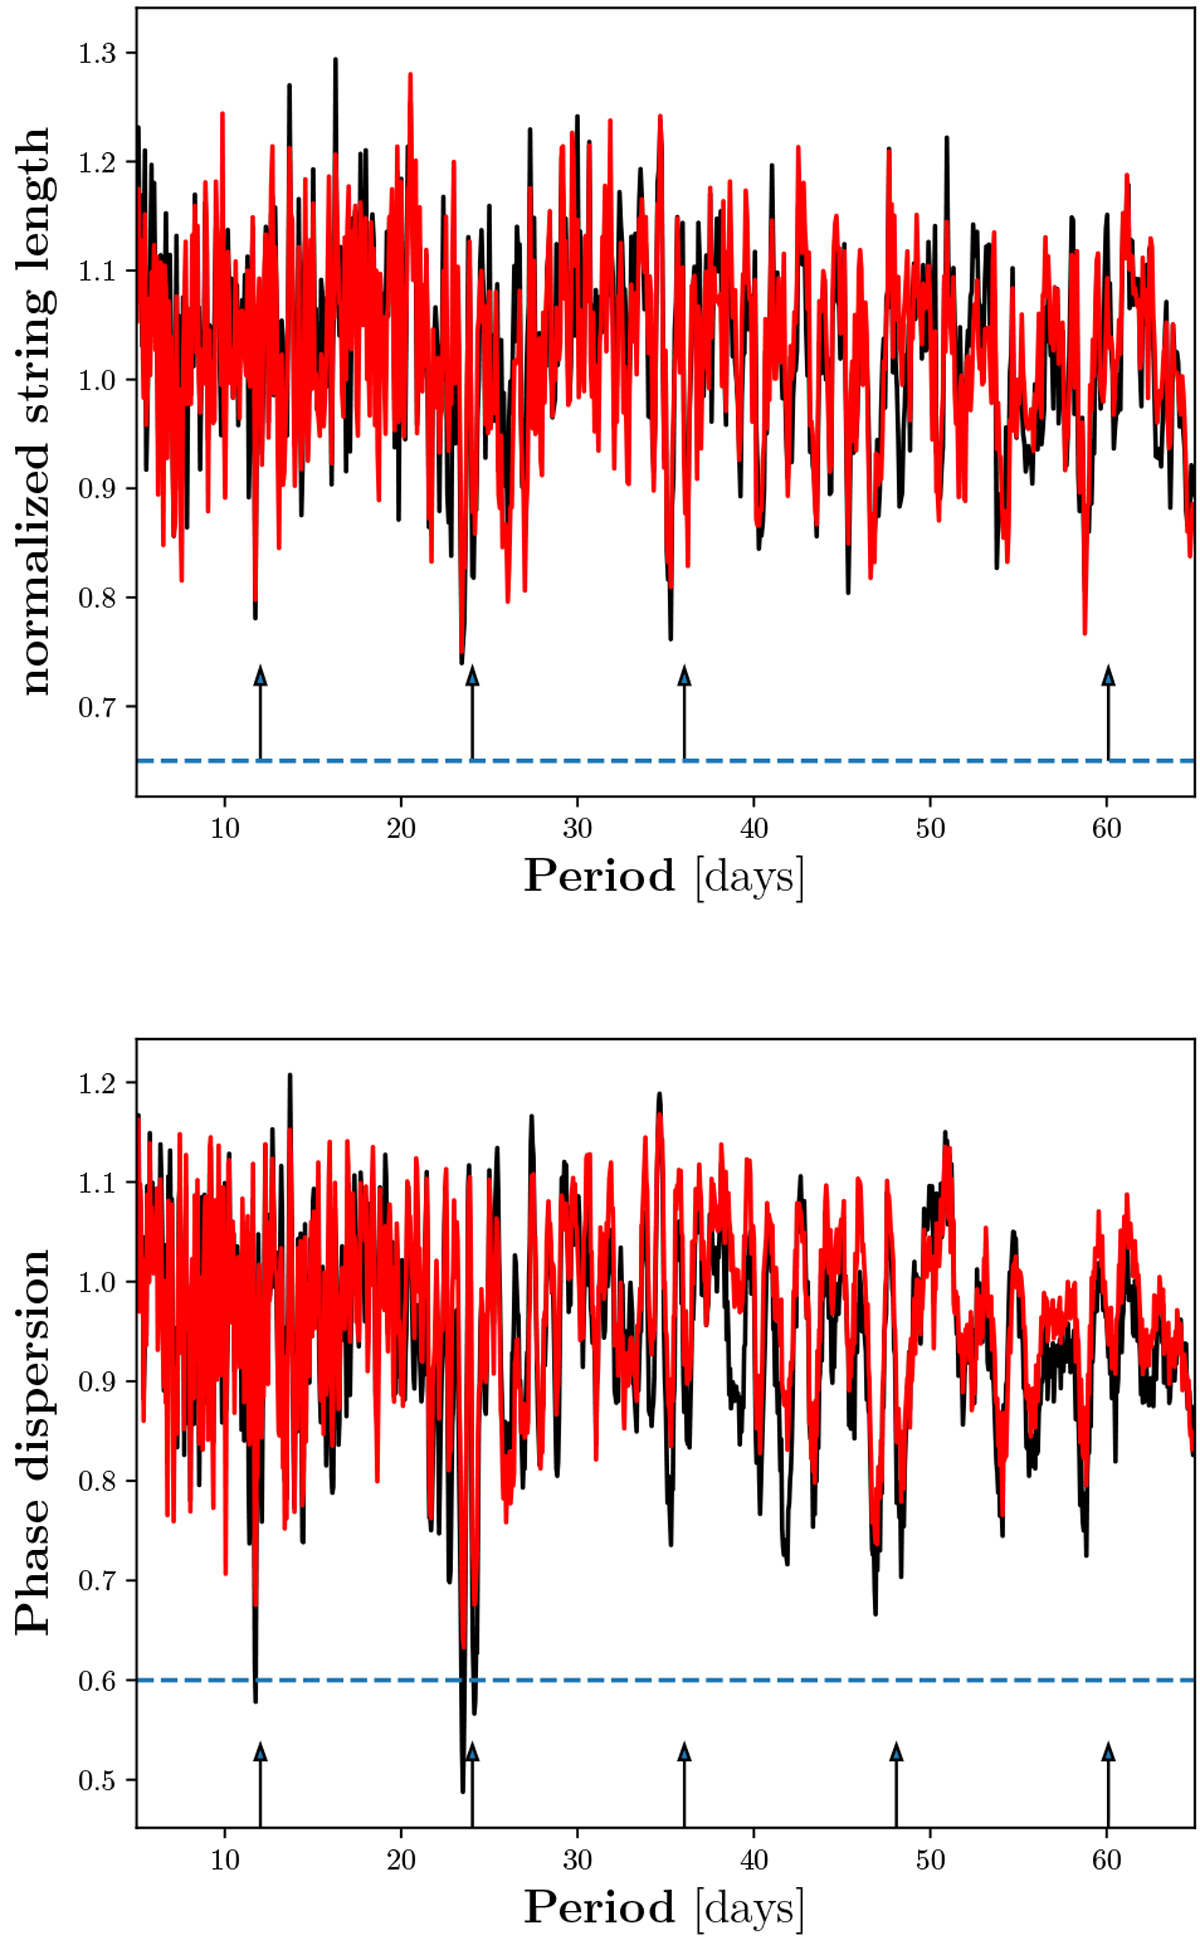
Fig. 3

Representative string length (top panel) and phase dispersion (bottom panel) diagrams for the star V2689 Ori. The black line denotes the computed Ln and Θn for IH α, respectively. The red line denotes Ln and Θn for ICa,1, respectively. The blue dashed horizontal line denotes the 1% FAP level below which a period would be significant. The arrows mark the photometrically measured period of 12.02 days (Kirkpatrick et al. 2012) and multiples.
Current usage metrics show cumulative count of Article Views (full-text article views including HTML views, PDF and ePub downloads, according to the available data) and Abstracts Views on Vision4Press platform.
Data correspond to usage on the plateform after 2015. The current usage metrics is available 48-96 hours after online publication and is updated daily on week days.
Initial download of the metrics may take a while.


