Free Access
Fig. 2
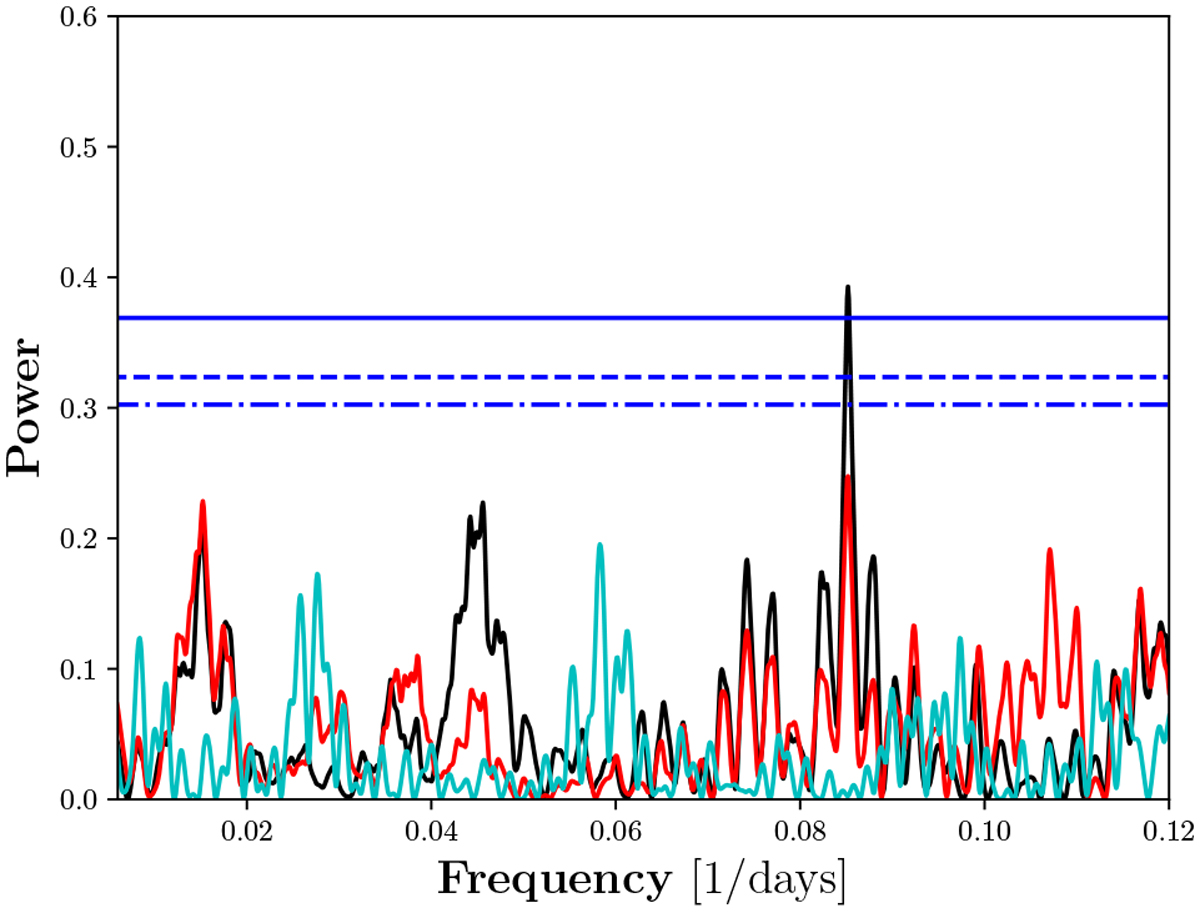
A representative GLS periodogram, here for the star V2689 Ori. While the horizontal dashed lines mark the 10 (blue/dot-dashed), 5 (blue/dashed), and 1% FAP levels (blue/solid), the power is given in black for IH α and in red for ICa,1. The cyan line denotes the window function.
Current usage metrics show cumulative count of Article Views (full-text article views including HTML views, PDF and ePub downloads, according to the available data) and Abstracts Views on Vision4Press platform.
Data correspond to usage on the plateform after 2015. The current usage metrics is available 48-96 hours after online publication and is updated daily on week days.
Initial download of the metrics may take a while.