Fig. 1
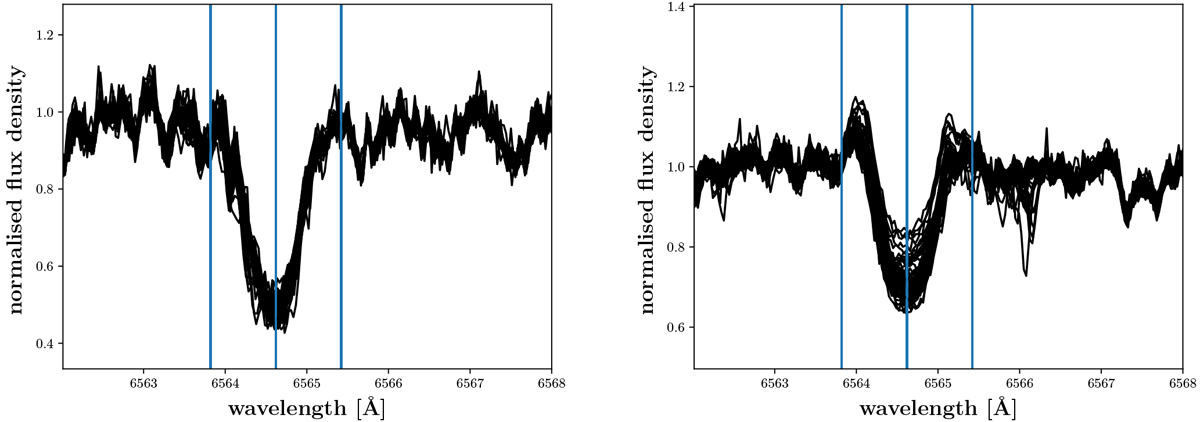
Two typical Hα line profiles for our sample stars: BD+44 2051A (left panel), one of the least active stars and V2689 Ori (right panel), the most active star in our sample. All usable spectra of the two stars are shown to demonstrate that the chromospheric line shows relatively small variations. The vertical lines correspond to the borders of our central wavelength interval.
Current usage metrics show cumulative count of Article Views (full-text article views including HTML views, PDF and ePub downloads, according to the available data) and Abstracts Views on Vision4Press platform.
Data correspond to usage on the plateform after 2015. The current usage metrics is available 48-96 hours after online publication and is updated daily on week days.
Initial download of the metrics may take a while.