Fig. 8
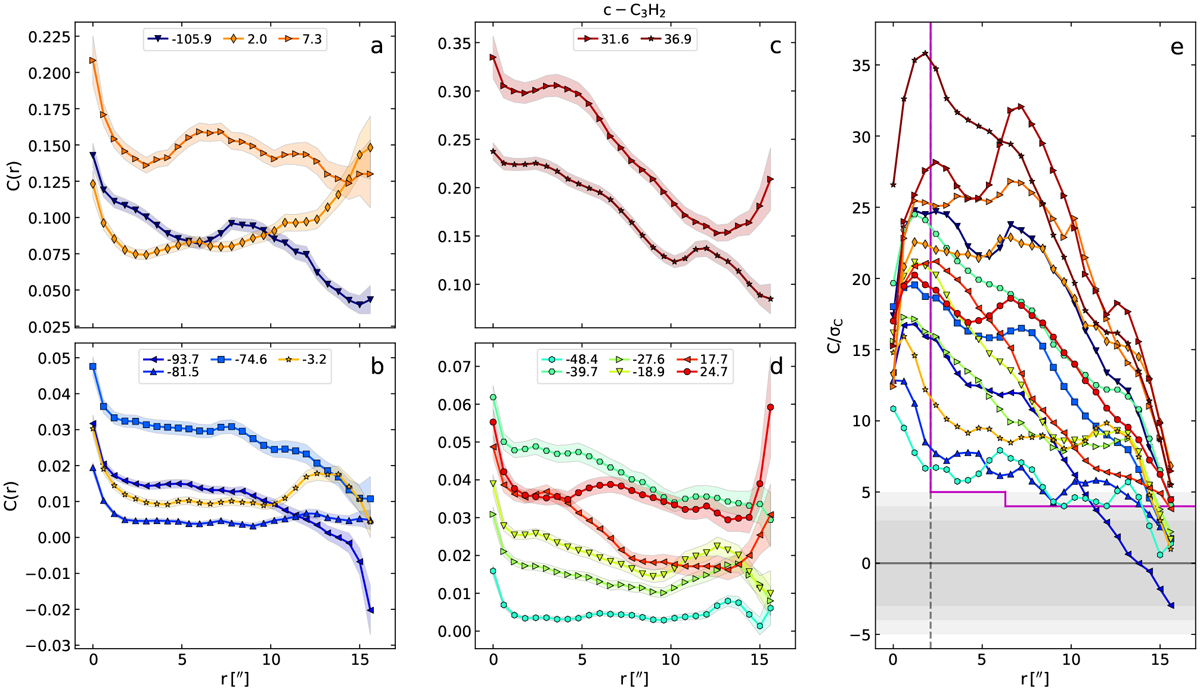
Panels a–d: two-point auto-correlation functions C(r) as a functionof pixel separation r for the velocity components traced with c-C3H2. The points give the mean values of the 1000 realisations and the colour-shaded regions represent the standard deviations (1σ). The centroidLSR velocities of the clouds are indicated in km s−1 at the top of each panel. Panel e: S/N of the two-point auto-correlation functions shown in panels a–d. The S/N levels of ±3, ± 4 and ± 5 are highlighted in shades of grey. The colours and symbols are the same as in panels a–d. The vertical dashed line shows the size of the beam (HPBW). The area below and left of the magenta line represents the area where the two-point auto-correlation functions are not significant.
Current usage metrics show cumulative count of Article Views (full-text article views including HTML views, PDF and ePub downloads, according to the available data) and Abstracts Views on Vision4Press platform.
Data correspond to usage on the plateform after 2015. The current usage metrics is available 48-96 hours after online publication and is updated daily on week days.
Initial download of the metrics may take a while.