Open Access
Fig. E.1
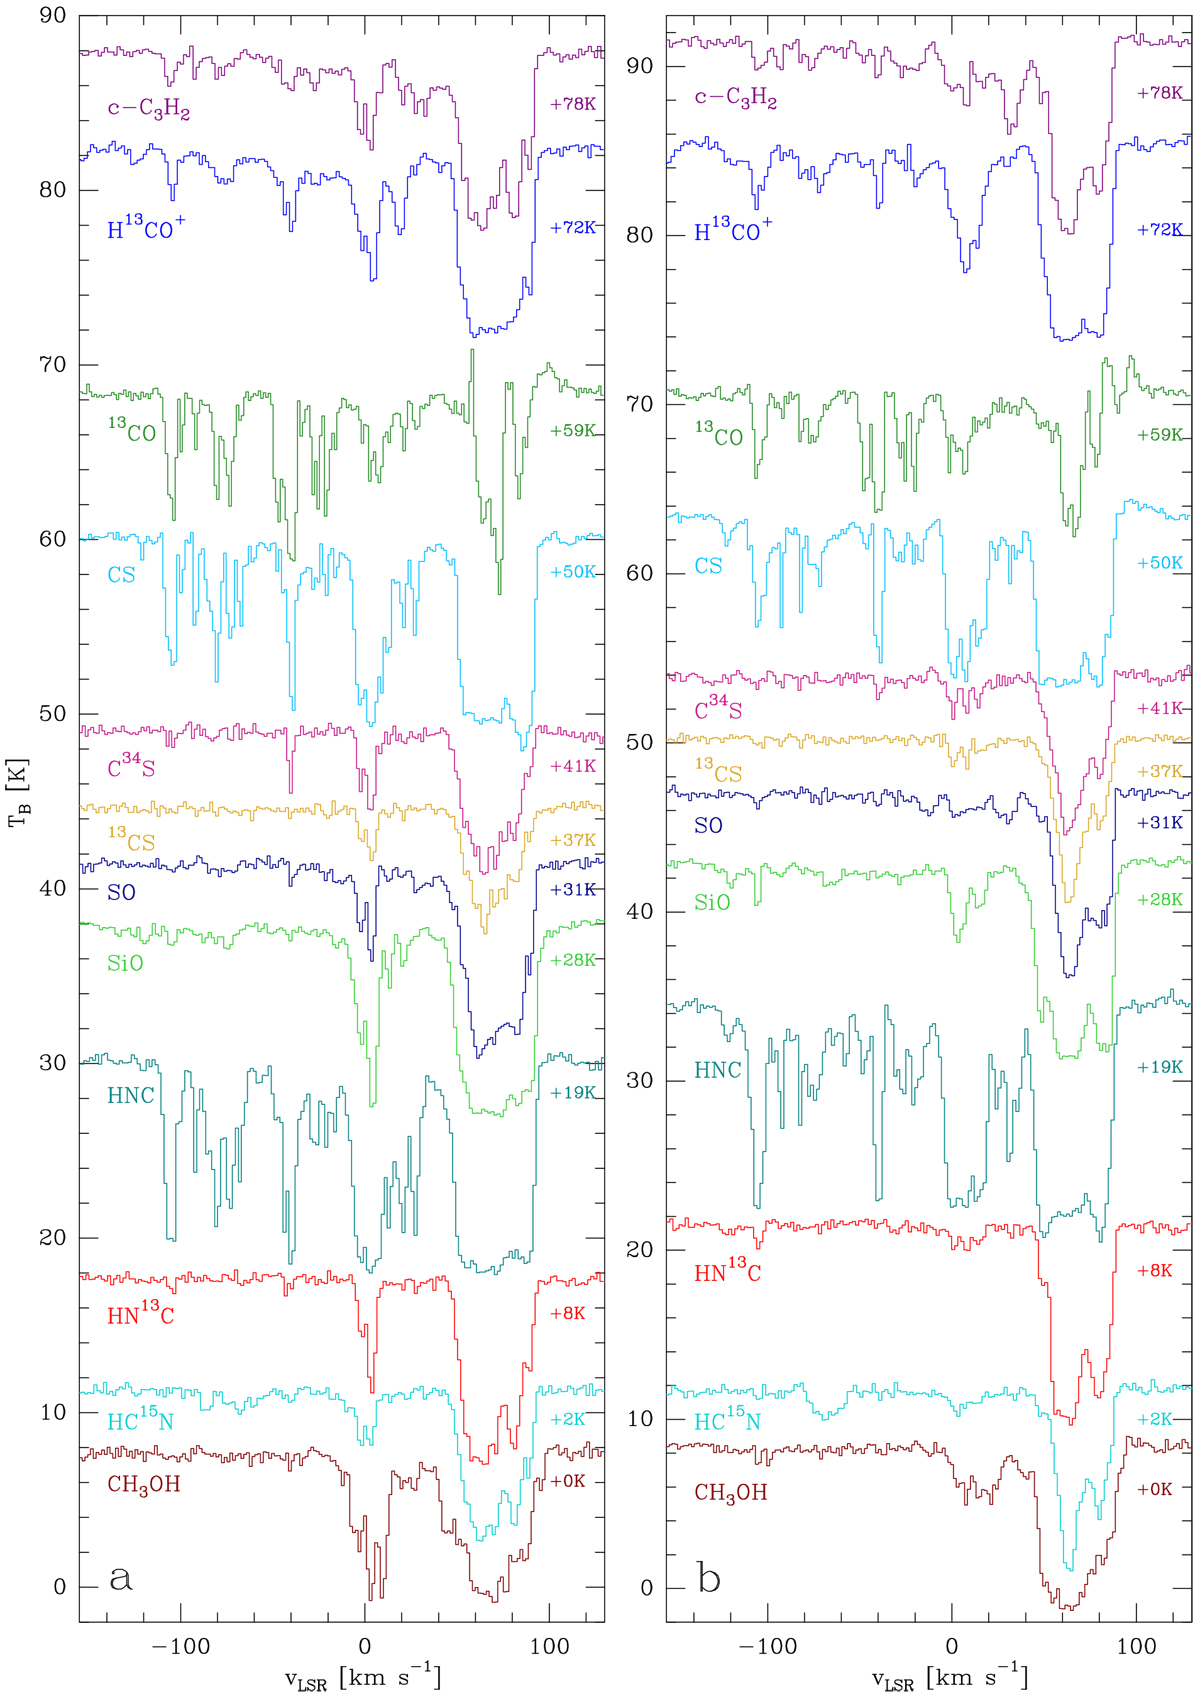
Spectra of the 12 investigated molecules towards K4 (panel a) and the peak of the shell of K6 (panel b). The spectra are shifted vertically by the amount indicated on the right.
Current usage metrics show cumulative count of Article Views (full-text article views including HTML views, PDF and ePub downloads, according to the available data) and Abstracts Views on Vision4Press platform.
Data correspond to usage on the plateform after 2015. The current usage metrics is available 48-96 hours after online publication and is updated daily on week days.
Initial download of the metrics may take a while.