Fig. 1
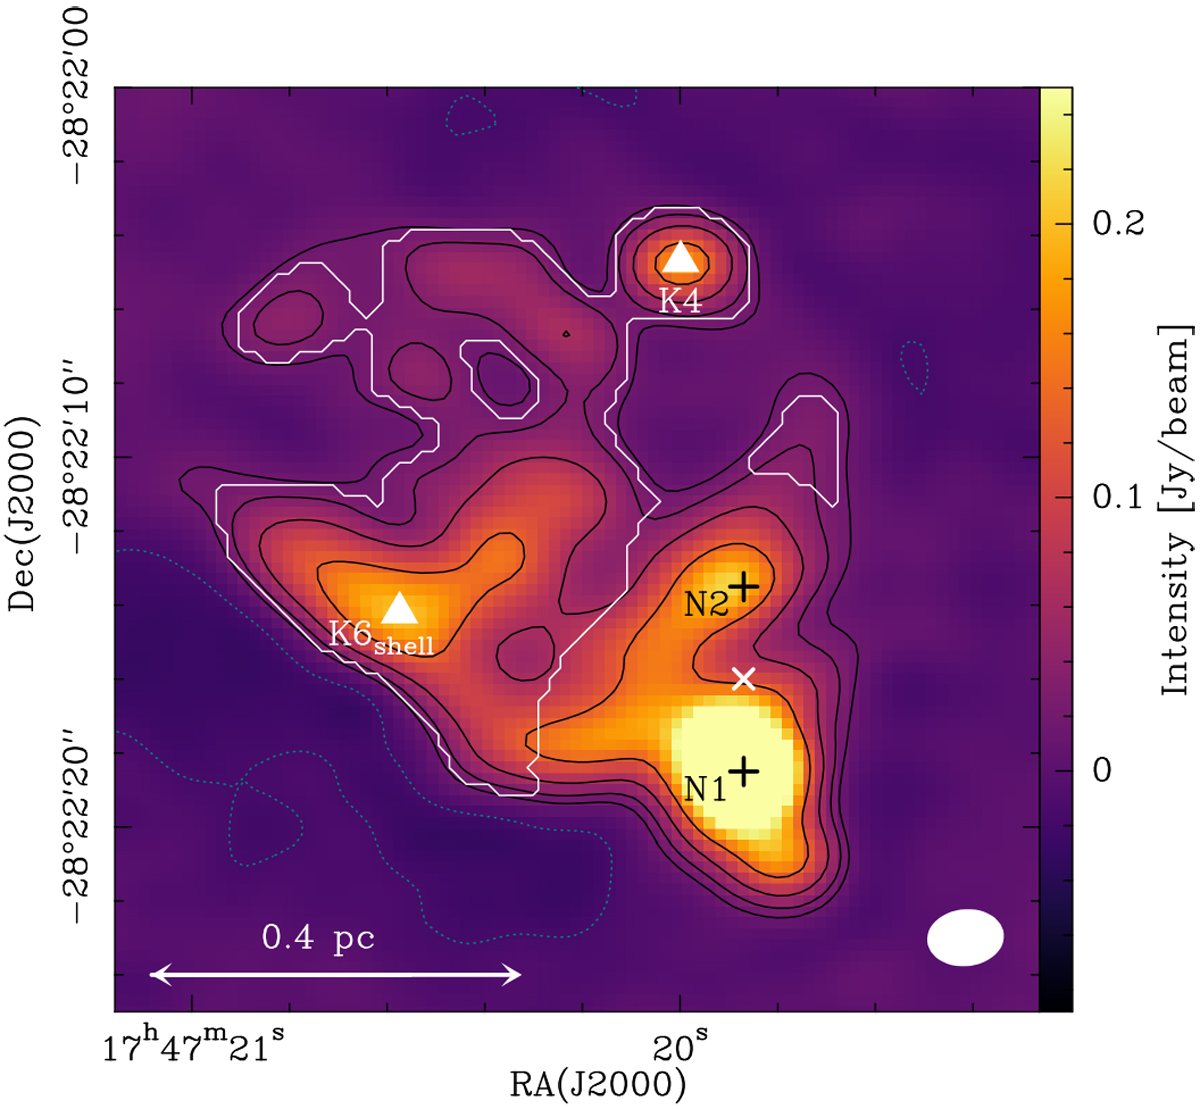
ALMA continuum map of Sgr B2(N) at 85 GHz. The black contour lines show the flux density levels at 3σ, 6σ, 12σ, and 24σ and the dotted ones mark −3σ, with σ the rms noise level of 5.4 mJy beam−1. The black crosses mark the positions of the hot cores Sgr B2(N1) and Sgr B2(N2), the white cross the phase centre (EQ J2000: 17h47m19.87s, −28°22′16′′), and the white triangles the ultra compact HII region K4 and the peak in the shell of the HII region K6 (Gaume et al. 1995). The white ellipse in the lower right corner is the synthesised beam. The white contour encloses the region selected for the analysis of the absorption features, for the particular case of ortho c-C3 H2. The pixel size in this image is 0.′′3.
Current usage metrics show cumulative count of Article Views (full-text article views including HTML views, PDF and ePub downloads, according to the available data) and Abstracts Views on Vision4Press platform.
Data correspond to usage on the plateform after 2015. The current usage metrics is available 48-96 hours after online publication and is updated daily on week days.
Initial download of the metrics may take a while.