Fig. 8.
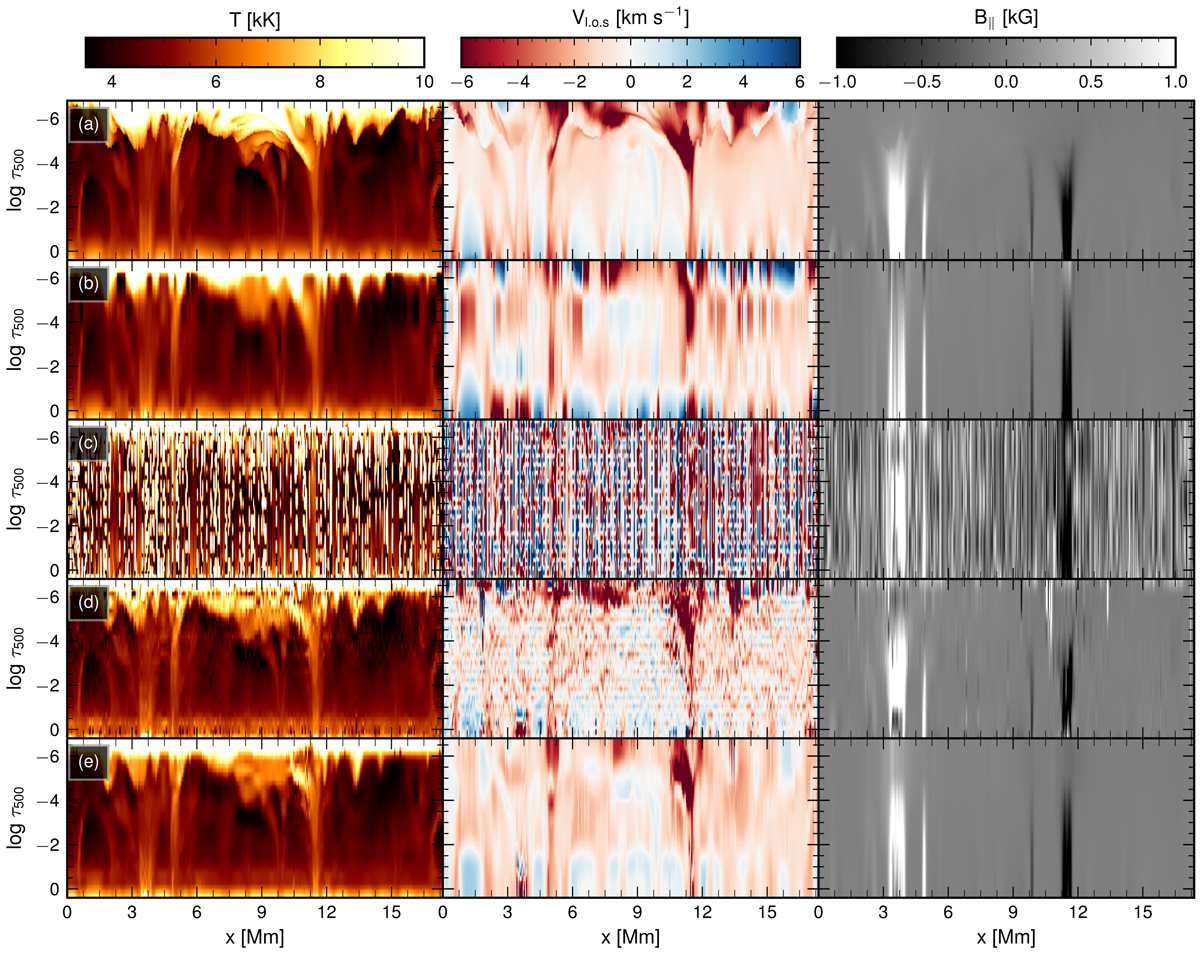
Inversion of a vertical slice from a 3D rMHD simulation. The panels illustrate from left to right the stratification in optical depth of temperature, line-of-sight velocity, and the vertical component of the magnetic field. Row a: original physical quantities from the MHD simulation. Row b: inversion computed without regularization and a small number of nodes. Row c: inversion computed without regularization and a very large number of nodes. Row d: inversion computed with understimated regularization and a very large number of nodes. Row e: inversion computed with a very large number of nodes and properly scaled regularization. The exact number of nodes of each experiment is indicated in Table 2.
Current usage metrics show cumulative count of Article Views (full-text article views including HTML views, PDF and ePub downloads, according to the available data) and Abstracts Views on Vision4Press platform.
Data correspond to usage on the plateform after 2015. The current usage metrics is available 48-96 hours after online publication and is updated daily on week days.
Initial download of the metrics may take a while.