Fig. 6.
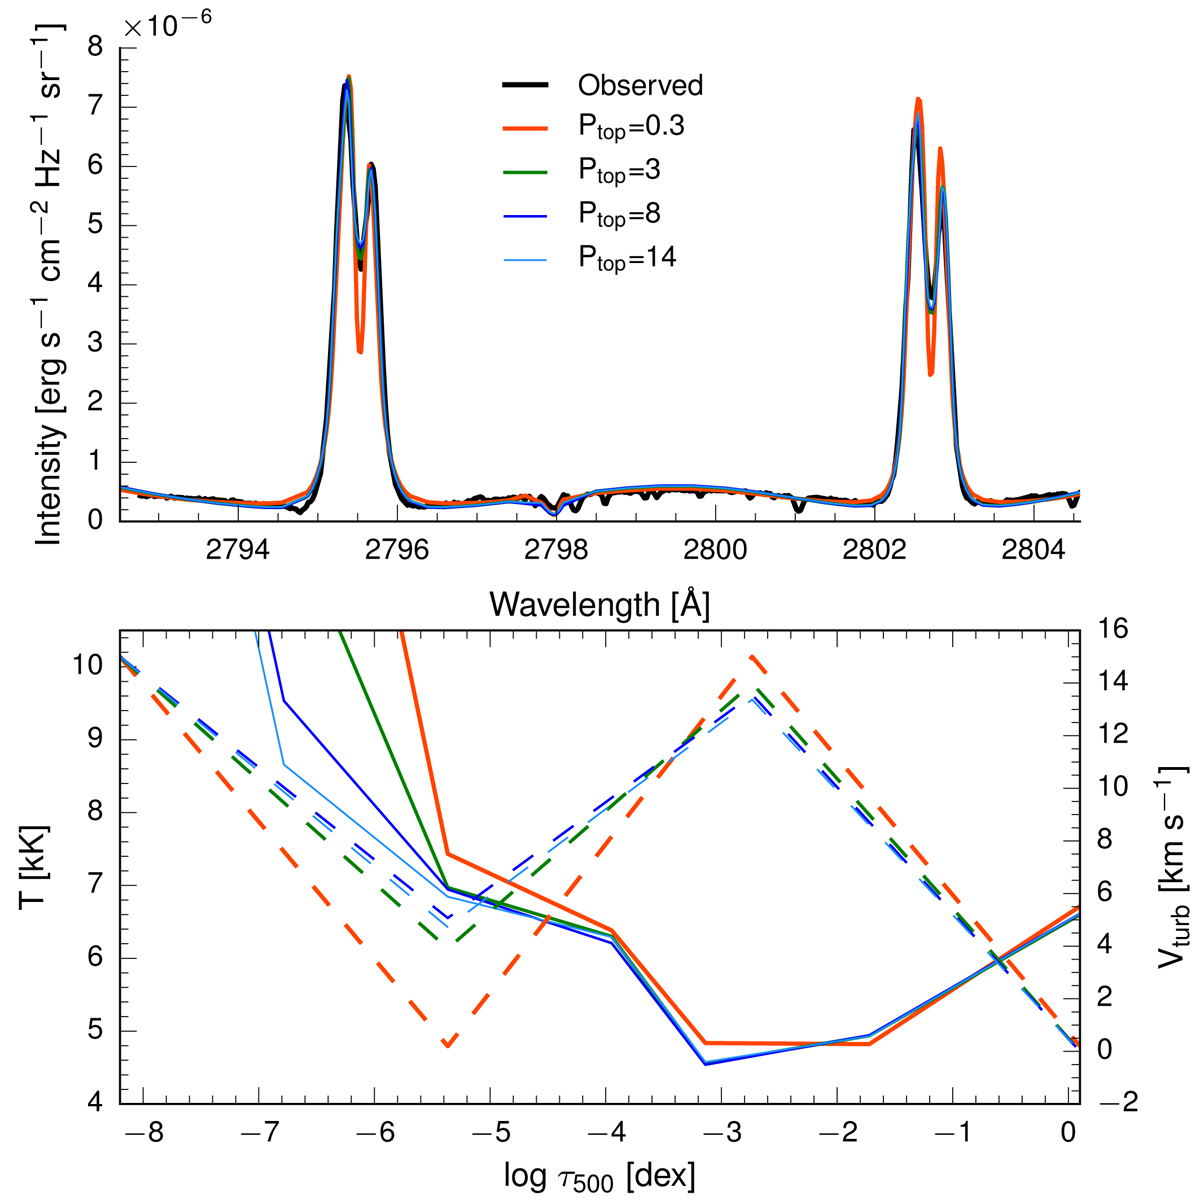
Inversions of one IRIS plage observation performed with various gas pressure values at the upper boundary of the model atmosphere. Top panel: fitted spectra (orange, green, navy and blue) and observed spectrum (black). Bottom panel: reconstructed stratification of temperature and turbulent velocity for each inversion, represented using the same color coding as in the upper panel.
Current usage metrics show cumulative count of Article Views (full-text article views including HTML views, PDF and ePub downloads, according to the available data) and Abstracts Views on Vision4Press platform.
Data correspond to usage on the plateform after 2015. The current usage metrics is available 48-96 hours after online publication and is updated daily on week days.
Initial download of the metrics may take a while.