Fig. 1.
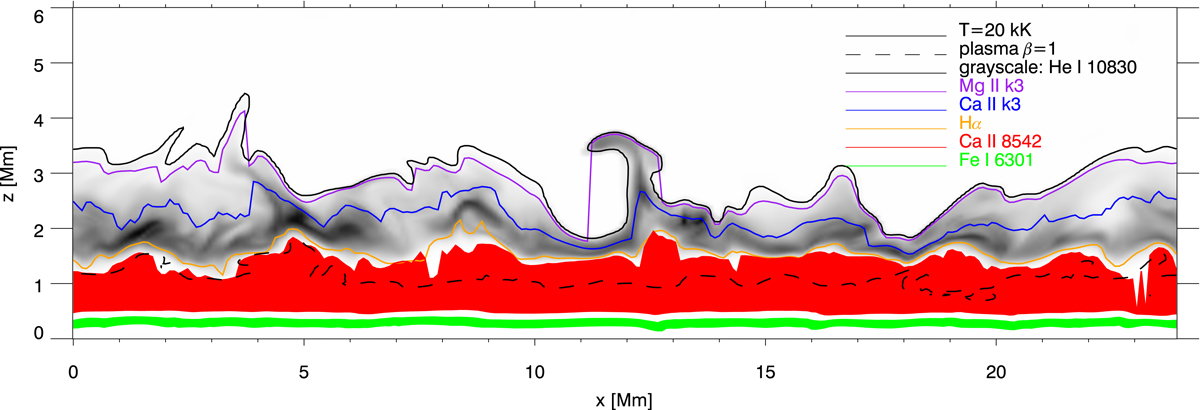
Vertical slice from a Bifrost radiation-MHD simulation, indicating the approximate formation height of different diagnostics. The solid lines indicate the τ = 1 layer at the core of the Mg II k line (purple), Ca II K line (navy) and Hα line (orange). The black solid line indicates the location where T = 20 kK and the dashed black line the plasma β = 1 layer. The gray shades illustrate the He I 10830 line opacity. We indicated the entire formation range of the Fe I 6301 line in green and the Ca II 8542 line in red.
Current usage metrics show cumulative count of Article Views (full-text article views including HTML views, PDF and ePub downloads, according to the available data) and Abstracts Views on Vision4Press platform.
Data correspond to usage on the plateform after 2015. The current usage metrics is available 48-96 hours after online publication and is updated daily on week days.
Initial download of the metrics may take a while.