Free Access
Fig. 8.
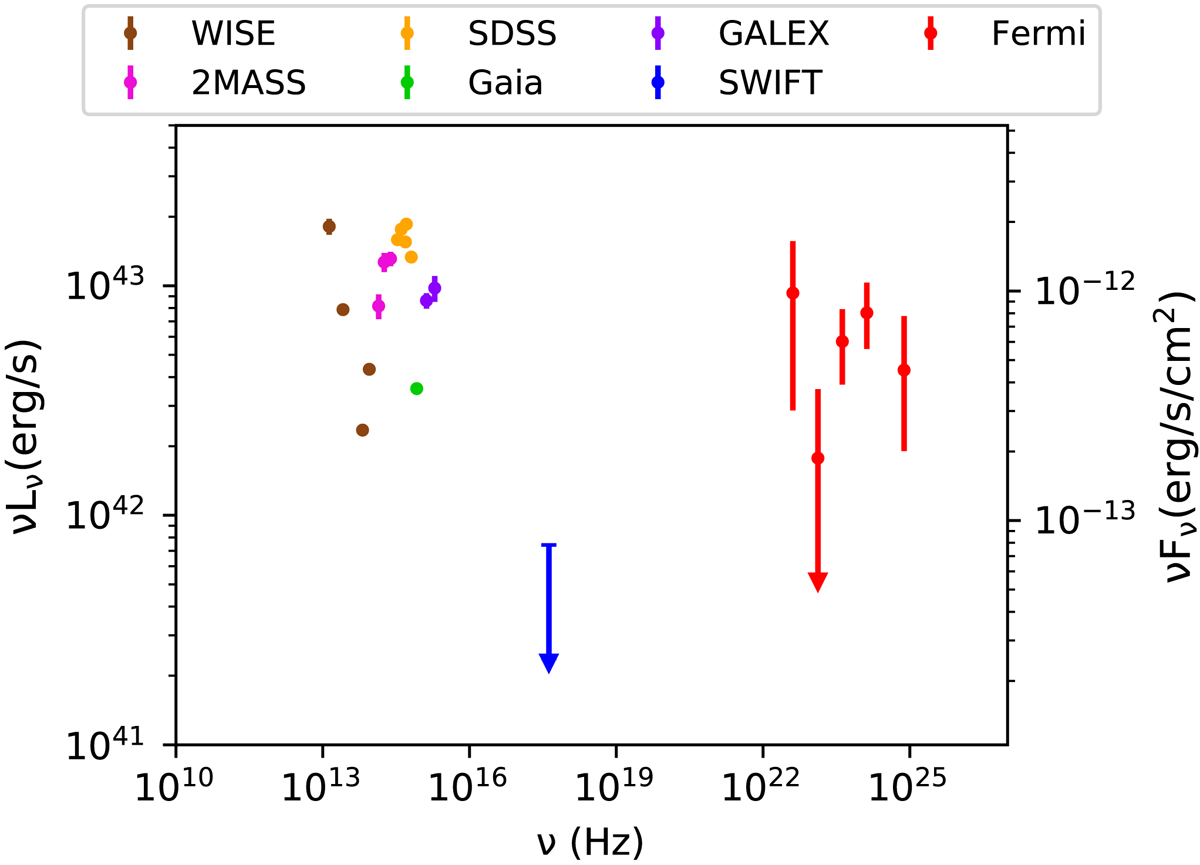
Spectral energy distribution for the UGSC and γ-ray data for 3FGL J0221.2+2518 from 3FGL. Red points correspond to Fermi data for the UGS, while the others correspond to measurements for UGSC.
Current usage metrics show cumulative count of Article Views (full-text article views including HTML views, PDF and ePub downloads, according to the available data) and Abstracts Views on Vision4Press platform.
Data correspond to usage on the plateform after 2015. The current usage metrics is available 48-96 hours after online publication and is updated daily on week days.
Initial download of the metrics may take a while.