Fig. 7.
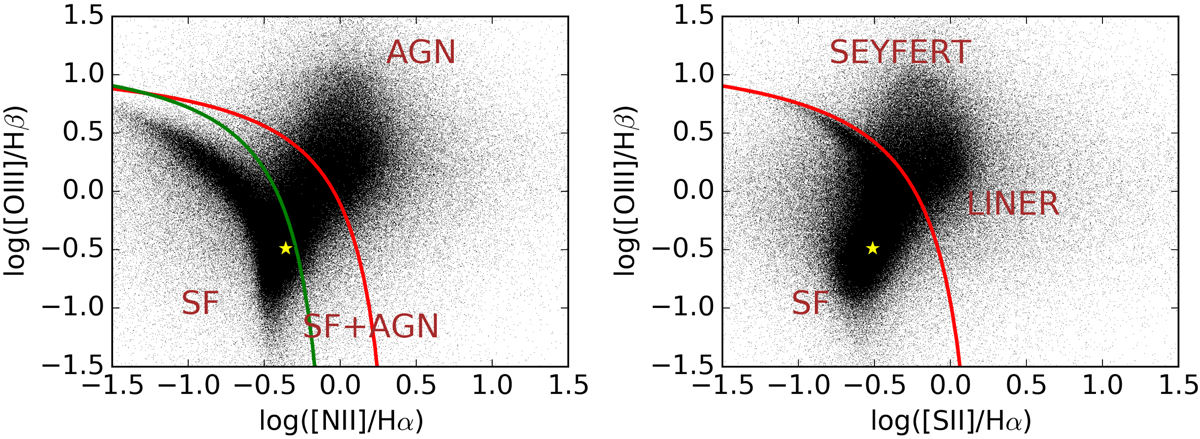
Baldwin–Phillips–Terlevich diagrams according to the Kewley et al. (2006) classification scheme, produced using SDSS DR7 data. The yellow star indicates the position of UGSC in the diagrams. The error bars are smaller than the symbol size and thus cannot be depicted. The red curve (Ke01) denotes the demarcation between star-forming galaxies and AGN as defined by Kewley et al. (2001). The green curve (Ka03) shows the same demarcation as defined by Kauffmann et al. (2003). SF stands for a star-forming galaxy region.
Current usage metrics show cumulative count of Article Views (full-text article views including HTML views, PDF and ePub downloads, according to the available data) and Abstracts Views on Vision4Press platform.
Data correspond to usage on the plateform after 2015. The current usage metrics is available 48-96 hours after online publication and is updated daily on week days.
Initial download of the metrics may take a while.